Despite a 15% decline in prices during an 18 month downturn, the Sydney property market was seeing a strong increase at the beginning of 2020, being on track to have a world leading price growth of 6%. That was until the impact of COVID-19 and its associated lockdown, which pushed prices into a sharp decline which could continue for at least 18 months. This has been compounded by the issue of significant over supply in the Australian property market more generally, as estimated demand has almost halved from 180,000 to 90,000 even though 188,000 new dwellings were under construction at the end of 2019.
Previously, a high level of housing approvals, low interest rates and a growing economy had lead to over 480,000 new dwellings being built across Australia since 2018. A lot of this growth has been concentrated in Sydney which saw a rise of 103,341 bringing its total to 1,643,00 occupied private dwellings. The map below illustrates the areas which have seen the highest total dwelling growth (indexed) across the greater Sydney region since 2016. Taking a closer look at these high growth areas, we can profile their demographics and gain a better sense of the key drivers behind their strong level of demand.

The Demographics of Demand for New Housing
Since 2016, Sydney has seen 31,503 new houses constructed with the the western suburbs of Box Hill, Marsden Park, Emondson Park, Oran Park & Schofields seeing the sharpest increases. Looking at the demographics (geoTribes & geoSmart segments) of the top 20 highest growth postcodes we can see that growth was primarily driven by establishing young multicultural families.
-

Housing Growth Across Sydney
-

Lifecycle Stages of Top 20 Housing Growth Postcodes
-

geoTribes of Top 20 Housing Growth Postcodes
-

geoSmart Segments of Top 20 Housing Growth Postcodes
The Demographics of Demand for New Units
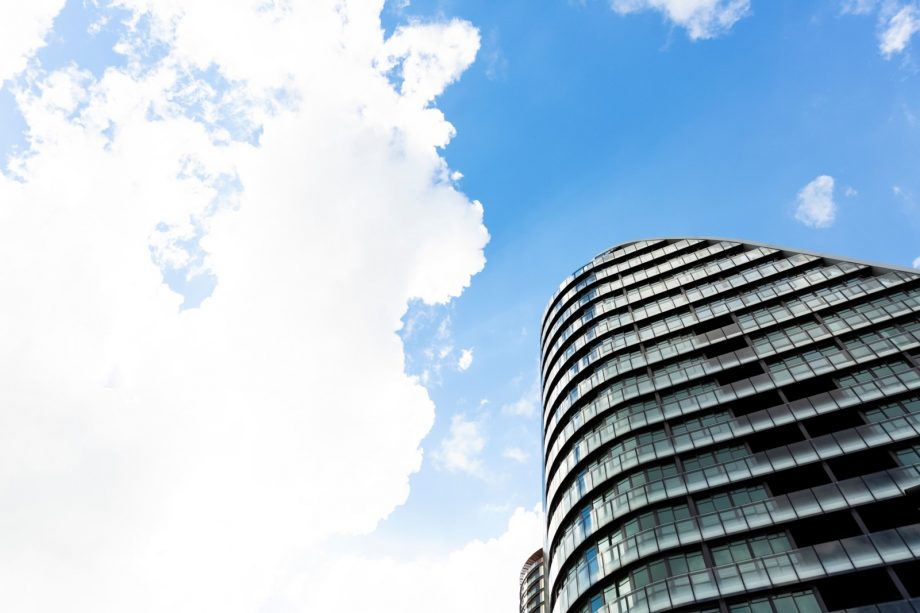
Since 2016, Sydney has seen 74,346 new units constructed, with the inner city suburbs of Barangaroo, Mays Hill, Mortlake, Wolli Creek and Wentworth Point seeing the sharpest increases. Taking a look at the demographics (geoTribes & geoSmart segments) of the 20 highest growth postcodes reveals that growth was primarily driven by young multicultural independents and university students. Given the restrictions imposed on international visitors and students, growth from these segments has seen a dramatic decline. Data from SQM research has shown that in June the number of rental vacancies jumped over 70% compared to the prior year.
-

Unit Growth Across Sydney
-

Lifecycle Stages of Top 20 Unit Growth Postcodes
-

geoTribes of Top 20 Unit Growth Postcodes
-

geoSmart Segments of Top 20 Unit Growth Postcodes
With the prospect of a second wave looming for Sydney, it’s unlikely that there’s promising news on the horizon for this hard hit market.
The Explorer’s 2019 Population Data Update:
A recent update to RDA’s population data served as the basis for the variables and mapping used for the analysis in this article. The new data captures the demographic and distributional changes which have occurred as the Australian population increased by 776,000 people since 2016. In effect, this update will impact almost all data across the system as it serves as the new “2019” population base from which variables (such as geoTribes and geoSmart) are derived.
The new modelled population was calculated by taking ABS population projection counts, localising them to SA1 geographic areas using the GNAF database and confirming its validity by using ABS building approval data.
If you have any queries about the population update or any of RDA’s services, contact the RDA Help Desk (info@geotribesexplorer.com or +612 8923 6655).