


Reading time: 12-14 minutes | Audience: Insight managers, brand strategists, segmentation owners, marketing directors and category heads in consumer-facing organisations
Summary
Australia’s premium and growth markets are being reshaped by specific migrant-origin cohorts, each concentrated in particular local catchments. Marketing strategy now needs cultural measurement at customer-base and trade-area level to optimise positioning with these groups.
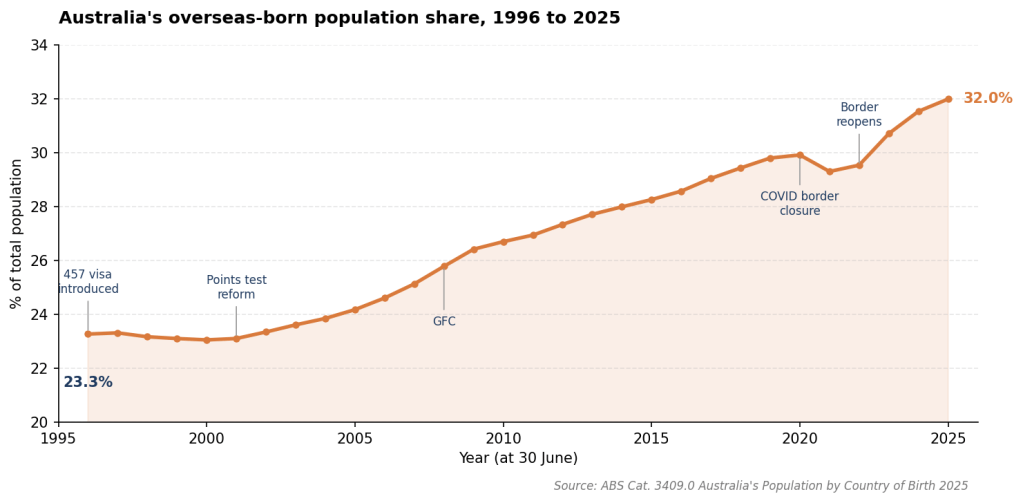
The overseas-born share of the Australian population reached 32.0% at 30 June 2025, up from 23.3% in 1996, and now, in a structural shift, Asia is the dominant source of migration. Three findings matter most for marketers:
- Scale and spending power. Australians born in Asia, Africa and the Middle East number approximately 5.3 million, almost one in five Australians, counting the first generation alone. The largest groups over-index on the top SES quintile: India 144, NE Asia excl. China 143, with Americas-born the highest single index at 169.
- Five distinct multicultural markets. The country-of-birth cohorts form five clusters with distinctly different cultural backgrounds and socio-economic profiles: top-quintile indices run from below 100 to 169 across the cohorts.
- Local concentration. Each cultural group tends to be concentrated in particular areas: in some shopping-centre catchments a single language group reaches more than 13 times its national penetration, and neighbouring centres serve different language mixes. Reaching a particular group through location-based channels depends on being present in the areas where it lives.
The population figures are ABS estimates; the SES, language and catchment measures are RDA modelled estimates.
geoTribes Explorer, Quick Append, Living Insights and our CALD Digital Audiences provide cultural measurement and activation at customer-base and trade-area level: location-level composition for out-of-home and retail decisions, population-benchmarked profiles of customer bases in minutes, cultural dimensions as an input to customer analytics and strategic planning at enterprise level, and ready-made cultural audiences on the major programmatic platforms.
Part 1: Background – How Australia’s Cultural Composition Has Shifted
The 29-year shift, 1996 to 2025
The data comes from the ABS release of Australia’s Population by Country of Birth (Cat. 3409.0, 29 April 2026). The total population grew from 18.22 million to 27.61 million over the 29 years to 30 June 2025, a 51.5% increase. Within that:
- Australian-born population: 13.98m → 18.78m, share 76.7% → 68.0%
- Overseas-born population: 4.24m → 8.83m, share 23.3% → 32.0%
The overseas-born population more than doubled while the Australian-born population grew by a third. The overseas-born share rose 8.7 percentage points over the 29 years.
The regional reordering
The 1996 overseas-born population was predominantly European and English-speaking. The 2025 population is Asian-led, with the three Asian regions comprising 48% of it. The major-group movements over 29 years:
| Region (SACC Major Group) | 1996 | 2025 | Change (29 years) |
|---|---|---|---|
| Southern and Central Asia | 159,300 | 1,746,350 | +996% |
| North-East Asia | 272,100 | 1,129,430 | +315% |
| Sub-Saharan Africa | 119,070 | 480,040 | +303% |
| Americas | 168,020 | 469,810 | +180% |
| South-East Asia | 494,820 | 1,365,970 | +176% |
| North Africa and the Middle East | 215,360 | 559,890 | +160% |
| North-West Europe (incl. UK) | 1,520,880 | 1,548,770 | +1.8% (essentially flat) |
| Southern and Eastern Europe | 883,950 | 666,600 | -24.6% |
The six non-European regions above added approximately 4.3 million people, 94% of the total overseas-born increase. Southern and Central Asia is now the largest overseas-born region at 1.75 million, ahead of North-West Europe including the UK at 1.55 million.
Country and country-group movements over 29 years
A small number of countries have driven the change.
| Country of Birth | 1996 | 2025 | Change (29 years) |
|---|---|---|---|
| India | 80,470 | 971,020 | +12.1x |
| Nepal | 1,410 | 213,580 | +151x |
| China (excl. SARs and Taiwan) | 118,640 | 731,540 | +6.2x |
| Pakistan | 8,710 | 143,920 | +16.5x |
| Bangladesh | 5,650 | 84,880 | +15.0x |
| Philippines | 104,820 | 412,530 | +3.9x |
| Korea (South) | 30,470 | 121,660 | +4.0x |
| South Africa | 61,810 | 229,950 | +3.7x |
| Zimbabwe | 10,320 | 52,830 | +5.1x |
| Iran | 19,260 | 95,690 | +5.0x |
| Iraq | 16,400 | 111,880 | +6.8x |
| Afghanistan | 7,170 | 96,180 | +13.4x |
| Brazil | 3,690 | 74,110 | +20.1x |
| Colombia | 2,870 | 65,380 | +22.8x |
| UK (incl. Channel Is. & Isle of Man) | 1,164,370 | 1,158,420 | -0.5% (flat) |
| Italy | 250,360 | 152,560 | -39.1% |
| Greece | 138,080 | 86,980 | -37.0% |
| Germany | 121,910 | 101,400 | -16.8% |
India passed England in 2025: 971,020 against 970,950, after trailing by 49,120 a year earlier. The full UK grouping in the table is still larger at 1,158,420, but on current growth (India +55,000 a year, the UK grouping +7,360) India will pass it around the end of the decade. Nepal has recorded the strongest proportional rise. The UK-born population is flat and ageing; Italy, Greece and Germany are declining as the post-war generation ages, with little replacement inflow.

The post-COVID period: shutdown, surge and return to trend
The ABS Overseas Migration release of 19 December 2025 (Cat. 3407.0) records the COVID disruption and the recovery that followed. Net Overseas Migration by financial year:
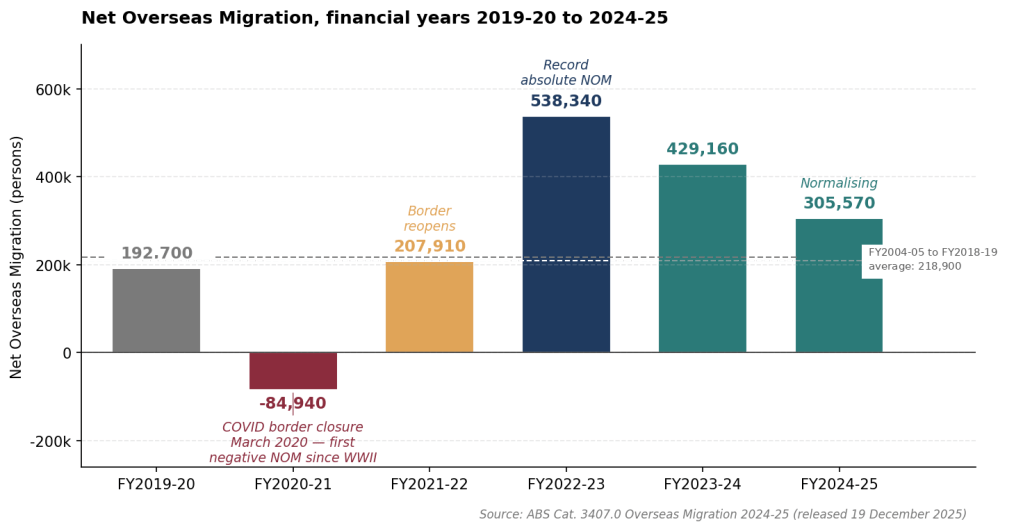
Cumulative Net Overseas Migration across FY2020-21 to FY2024-25 was +1.40 million, more than six years of pre-pandemic flow compressed into three financial years. The surge broadly preserved the existing mix of source countries. India remained the largest source at 57,410 (down from 95,030 at the FY2022-23 peak), China contributed 35,160, and five further South and South-East Asian sources 68,850 between them. The recovery was uneven between the two largest Asian sources: the Chinese-born population fell from 661,460 in 2019 to 584,660 in 2021 and did not regain its 2019 level until 2024, while the Indian-born population never fell below its 2019 level.
Australian-born Net Overseas Migration has been negative every year since FY2004-05 (two minor exceptions during border closure), at -17,060 in FY2024-25. The 2024-25 migration estimates are preliminary. Even at moderating total flow, the overseas-born share keeps rising.

The 2024 → 2025 movements in detail
One-year movements confirm the composition is still shifting even as total migration returns to trend.

India added the largest absolute volume at +55,000, or 21% of the +258,440 total overseas-born gain. The broader Asian-source cohorts (China, Philippines, Nepal, Sri Lanka, Bangladesh, Pakistan, Afghanistan) added 106,000 between them, over 40% of the year’s growth. China added 31,900; North-East Asia added 40,310 against Southern and Central Asia’s 115,790. The UK’s +7,360 is the first material year-on-year gain in over a decade. The declines reflect the advanced age of the long-settled European cohorts. The 2025 country-of-birth estimates are preliminary.
Four conclusions
- The shift is structural. Australian-born children under 15 are more diverse in ancestry than the 15+ cohort they will eventually replace, a direct result of family formation by migrants aged 25-44 through 2010-2019. Much of Australia’s future population composition is therefore already set; migration policy may change the pace and mix of the shift, not its direction.
- The Italian-born and Greek-born populations are declining as the cohort ages. The combined population fell 38.4% over 29 years (388,440 to 239,540). On recent rates of decline they will be roughly half their 2025 size within 15 years. Germany and Western Europe will follow with a small lag.
- Southern and Central Asia is now the largest overseas-born region. It reached 1.75 million in 2025, passing North-West Europe including the UK (1.55 million); its 29-year increase of 1.59 million is more than a third of the total overseas-born increase. India is the region’s largest group at 971,020, past England and less than 200,000 below the full UK grouping. It has recorded the highest one-year Net Overseas Migration of any country and concentrates in the 25-44 working-age bracket.
- Chinese and North-East Asian growth has slowed. The Chinese-born population grew 6.2x over 29 years to 731,540, but recently the pace has halved: it added 152,590 across 2015-2019 and 92,550 across 2020-2025, and did not regain its 2019 level (661,460) until 2024. Its 2024-2025 gain of 31,900 compares with India’s 55,000. Across the five years to 2025, North-East Asia added 160,690 against Southern and Central Asia’s 508,970; the source of Asian migration growth has shifted from East to South Asia.
Part 2: Significance for Australian Marketers
Part 1 documented the shift in Australia’s population. Its significance for marketers rests on three findings, in order of importance:
1. Scale and spending power
Australians born in Asia, Africa and the Middle East now number approximately 5.3 million, close to 60% of the overseas-born population and almost one in five Australians. That count only covers the first generation; the Australian-born second generation adds to it. The cohort is diverse in origin but concentrated in a few large groups. Southern and Central Asia is the largest component: India (971,020) accounts for over half of it, with Nepal, Pakistan and Bangladesh among the fastest-growing groups in the data. China (731,540) leads North-East Asia. Its largest groups over-index on Australia’s top socio-economic quintile (India 144, NE Asia excl. China 143), which supports higher capacity to pay and stronger potential lifetime value in the cohorts growing fastest. Within the region the pattern splits: Indian-born at 144, the rest of the region below 100.
The geoTribes synthetic population assigns households to one of ten SES deciles (a composite of income, education and occupation). The top quintile (deciles 9 and 10, 4.21 million 15+ Australians) is where premium-category buyers concentrate. Eight country-of-birth cohorts over-index on it:

Australian-born indexes at 92: 2.41 million in the top quintile, 57% of it against a 62% share of the 15+ population. The eight migrant cohorts contribute 1.19 million between them, 28% of the quintile and the part growing fastest in volume.
Premium financial services, automotive, private health, branded retail, technology, household goods and travel categories now compete for share inside a top quintile that is increasingly migrant-weighted and still shifting year on year. The task for marketers is to align their value proposition to the quintile’s evolving composition.
2. Five distinct multicultural markets
The country-of-birth cohorts form five clusters with distinctly different cultural backgrounds and socio-economic profiles:
| Market | Source regions | Top SES quintile (index) | Profile and trajectory |
|---|---|---|---|
| Older European cohorts | Italy, Greece, S&E Europe; older segments of the German, UK and NW European populations | Italy, Greece, S&E Europe below 100 | Oldest cohort (Italy/Greece 75+ at index 605/691); will contract substantially over the next 15 years as the generation ages |
| Asian skilled-migrant | India, China, NE Asia, S&C Asia | India 144, NE Asia excl. China 143, China 111; S&C Asia excl. India below 100 | Concentrated 25–44 working age; largest and fastest-growing |
| Affluent professional migrant | Sub-Saharan Africa, NW Europe (excl UK/Germany), UK | Highest: NW Europe 164, Sub-Saharan 163, UK 141 | Highest capacity to pay |
| Americas growth cohort | Americas: USA, Canada, South and Central America and the Caribbean; largest groups USA (122,030), Brazil (74,110) and Colombia (65,380) | 169 (highest single index) | Small base (419,000 aged 15+); growing via post-2015 Colombian, Brazilian & Mexican migration inflows |
| Vietnamese-Oceanian settled | Vietnam, Oceania (excl Australia & NZ) | Under-represented (below 100) | Long-settled, with below-average socio-economic position |
Three clusters (Asian skilled-migrant, affluent professional migrant and Americas growth cohort) together represent close to 5 million Australians aged 15+. They hold the strongest top-quintile positions in the data. For marketers, the significance is that culture matters beyond country of birth. It’s the context and background of these groups, reflected in their varying socio-economic & demographic profiles, that is as important to understand.
3. Each cultural group tends to be concentrated in particular local areas
The overall Non-English-language pattern is visible on the metropolitan map. The Sydney overview at SA1 level is shown below in Figure 7.

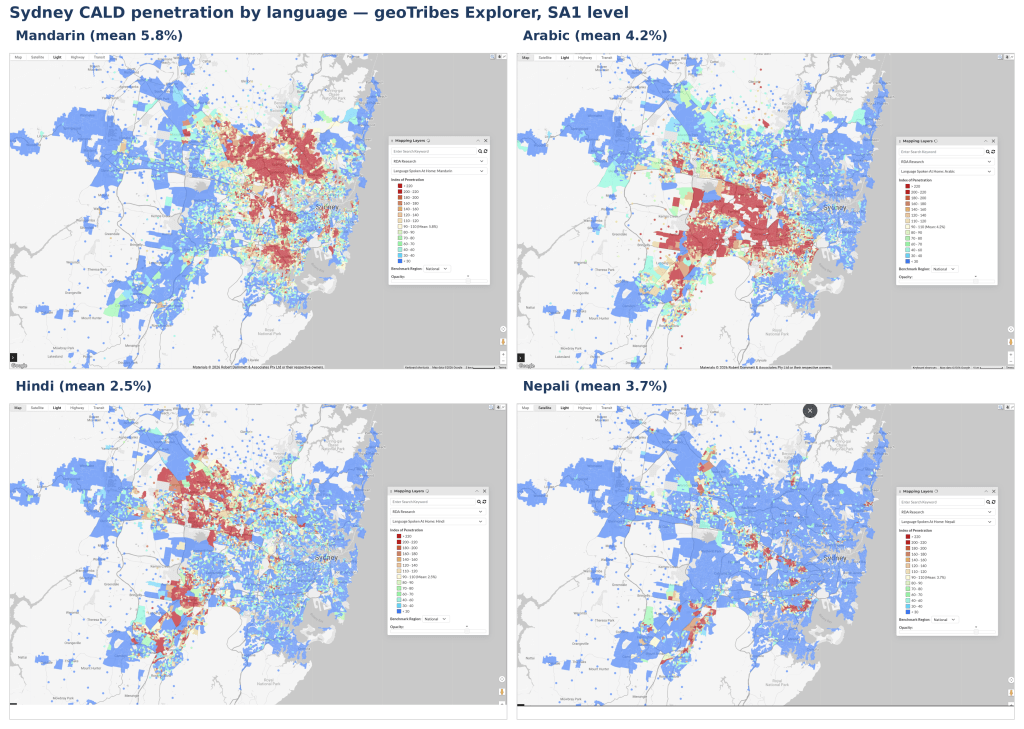
Figure 8 shows Mandarin, Arabic, Hindi and Nepali individually at SA1 level, revealing sharply different patterns within the same city. Mandarin concentrates in the north-shore corridor (Chatswood, Eastwood, Hornsby) and around Macquarie Park. Arabic in the south-west (Bankstown, Fairfield, Liverpool). Hindi around the north-west growth corridor (Marsden Park, Quakers Hill, Parramatta) with secondary pockets near Westmead and Liverpool. Nepali is more dispersed across the outer growth fringe. The four groups occupy largely separate geographies, so location-based marketing activity such as out-of-home placement, store location and local-area media has to be specifically targeted to reach a specific language group.
The 298 major-format Australian shopping centres (Bulky Goods, Major Regional, Regional, Super) illustrate how much catchment cultural composition varies across retail centres. Language penetrations (language spoken at home; RDA modelled estimates from the geoTribes Explorer) are indexed to the national average of 100; a value of 1,323 means 13.2 times the national penetration.
Three patterns stand out:
- Single-language dominance is common at the extremes. Bankstown Central’s catchment holds Arabic at 13.2x and Vietnamese at 6.5x. Warwick Farm Hometown is more concentrated still: Vietnamese 13.7x, Arabic 10.6x. Concentrations of this size determine the addressable market in those catchments.
- Catchments differ in kind. Stockland Wetherill Park (Vietnamese 13.2x, Arabic 6.9x, Mandarin 0.8x) and Lidcombe Centre (Korean 10.1x, Mandarin 3.8x, Cantonese 4.5x) sit 8 km apart but serve different language compositions.
- Cross-state specialisation is also visible. Craigieburn Central (Melbourne outer north) tops the Punjabi index at 900 but indexes only 18 on Mandarin. Forest Hill Chase (also Melbourne) indexes 611 on Mandarin and 44 on Arabic. Signage, staffing, supplier and tenancy decisions should be influenced by the catchment’s cultural composition.

Figure 9 plots Arabic and Mandarin indices across the 60 most diverse centres. Four clusters stand out: a Mandarin-led North Shore and inner-east cluster (Forest Hill Chase, The Glen, Top Ryde, Macquarie Centre), an Arabic-led south-west Sydney cluster (Bankstown Central, Stockland Merrylands, Warwick Farm, Hoxton Park), a mixed-Asian Auburn-Lidcombe corridor (high Mandarin, Cantonese, Korean), and a Punjabi-led outer-Melbourne cluster (Craigieburn, Melton, Werribee) that is highly diverse without Arabic or Mandarin.
Part 3: How geoTribes Tools Can Help
Parts 1 and 2 measure the market as a whole. The geoTribes Platform provides cultural measures against an organisation’s own locations and customer bases, built on a synthetic population of Australian households. The population is calibrated to the ABS Census and updated between Censuses by a population update model that combines verified housing growth with the published country-of-birth and Net Overseas Migration series, keeping the small-area cultural estimates current. Country of birth, ancestry and language sit alongside lifecycle stage, SES and the 15-segment geoTribes scheme. Four tools apply it: geoTribes Explorer for location decisions, Quick Append for customer-base profiling, Living Insights for enterprise analytics, and our CALD Digital Audiences for digital media activation.
geoTribes Explorer – CALD estimates aligned to the latest ABS cultural composition
geoTribes Explorer maps the cultural composition each location serves, from national level down to SA1, aligned to current ABS country-of-birth, ancestry and language data. The Sydney maps at Figures 7 and 8 are Explorer output.
Key applications:
- Out-of-home media planning
- Retail catchment analysis
- Network and branch planning
- Defining the geography for in-language campaigns
Quick Append – Estimating the cultural composition of a customer base
Quick Append shows the cultural composition of customer databases, benchmarked against the population. A sanitised customer sample (up to 20,000 records) or survey file produces a population-benchmarked profile in under five minutes. Minimal PII is uploaded and removed in processing at the earliest possible step.
Key applications:
- Customer-base cultural profiling against national benchmarks
- Separate profiles for up to 15 user-defined segments or buyer groups
- AI-ready output for interactive analysis in your own LLM
Figure 10 shows an example of Quick Append output: a profile of respondents reporting usage of a major short-form video platform, indexing country of birth against the 15+ population. The platform reaches the Asian skilled-migrant cluster well above population rates (Indian-born 136) and the post-war European cohorts well below (Greek-born 30).

Living Insights – Parametric enhancement of an enterprise customer base
Living Insights adds cultural dimensions to enterprise customer analytics and planning. It appends the segmentation and probabilistic cultural profiles to customer records at enterprise scale, delivered via secure web or SFTP into CRM, data warehouse, marketing cloud and Snowflake environments. The CALD measures sit as data within the Consumer Demographics data pack.
Key applications:
- Aggregate cultural profiling of segments, regions and branch networks
- Analyse product usage patterns across cultural groups
- Estimating the impact of cultural background on lifetime value and churn rates.
- Adding cultural dimensions to enterprise segmentation schemes
RDA’s CALD Digital Audiences – Ready-made cultural segments for digital media buying
RDA’s CALD Digital Audiences carry the cultural estimates into digital media buying. Through the RDA Research partnership with Eyeota, 18 audiences calibrated to the latest 2025 CALD estimates are distributed across Eyeota’s network of more than 30 platform partners: 17 language-spoken-at-home audiences (Arabic, Bengali, Chinese languages, Greek, Gujarati, Hindi, Italian, Korean, Malayalam, Nepali, Punjabi, Sinhalese, Spanish, Tagalog, Tamil, Urdu and Vietnamese) and an overall CALD audience. Eight demand-side platforms carry the audiences off the shelf, among them The Trade Desk, Google Marketing Platform, Xandr and Yahoo; the rest of the network, including the social platforms, carries them by request. The set covers every language group featured in the catchment analysis in Part 2, so the corridors identified in Explorer can be matched with in-language digital delivery.
Key applications:
- In-language digital campaigns delivered through the buyer’s media agency
- Digital activation of the corridors and catchments identified in Explorer
- Digital reach against cohorts identified in a Quick Append or Living Insights profile
- Social platform activation by request (Facebook, Instagram, TikTok, Pinterest, X)
Figure 11 shows two of the audiences at SA1 level in Sydney: Chinese languages and Nepali. The concentrations mirror the corridor patterns in Figure 8; the audiences make the same populations addressable directly in digital media.

Getting Started
To apply these tools:
- geoTribes Explorer: request a demonstration via the geoTribes website at geotribes.com
- Quick Append: run a cultural-composition profile of a customer base in under five minutes at Quick Append
- Living Insights: discuss enterprise-scale CALD appending by contacting support@geotribes.com
- RDA’s CALD Digital Audiences: search for RDA Research in the audience marketplace of an off-the-shelf platform, or contact support@geotribes.com for by-request activation