With the initial release of the Australian Bureau of Statistics (ABS) 2016 Census Data, RDA Research has re-modelled the geoTribes Culture Dimension. By providing an area-level measure of cultural influence, the scheme illustrates how an increasingly multicultural Australian population has manifested geographically.
The geoTribes Culture Dimension is a proprietary framework developed by RDA to encapsulate the primary cultural driver of the areas people live in. As a classification of the type of environment rather than the people themselves, the Dimension represents the factors that someone experiences as they walk down a street near where they live. This provides a valuable perspective as the type of environment is an important determinant of how the population develops their purchasing behaviour.
Key Changes
Compared to the 2011 Census, the biggest reduction was a 7.4% drop in the percent of Usually Resident Population (aged 18+) living in Caucasian classified areas, decreasing from 46.3% to 42.9%.
The stand out change was a 150% increase in the proportion living in areas of South-Asian Influence (Afghanistan, Bangladesh, India, Nepal, Pakistan & Sri Lanka), which grew from 1.9% to 4.8%.
Chinese Influence demonstrated the second largest percentage increase, with a growth of 44% shifting the proportion of the population living in those areas from 4.2% to 6.0%. Greek Influence saw a similar percentage change but in the opposite direction, declining from 0.8% to 0.4%.
Italian and Middle-Eastern Influence declined at a similar but lesser rate of 24.7% and 21.8% respectively.
The velocity of migration from South Asian and Chinese areas has led to a consolidation and concentration of cultural areas. Previously there were relatively more areas with a diverse cultural mix, now the consolidation has presented a much more distinctive character.

States & Territories
The distribution has remained varied nationwide, with Victoria challenging New South Wales as the most culturally diverse State. Between these two, the relativity of the Chinese and South-Asian Influence is reversed. Queensland remains predominantly Caucasian, as does Tasmania. Multicultural Mix is strong in South Australia and Western Australia but not so much for the other groups, meaning they have more diverse communities.
Percent of Usually Resident Population (aged 18+) Living in geoTribes Culture Dimensions

Changing Cities
Consolidation and expansion of existing pockets characterises the spatial distribution of change, with the marked increase in Chinese and South Asian Influence areas occurring in different types of areas.
High socio-economic predominantly Caucasian areas and universities attracted an increase in Chinese Influence, whereas new housing developments along city fringes include a clear South-Asian Influence. The latter has also emerged within previously less-distinctive Multicultural areas.
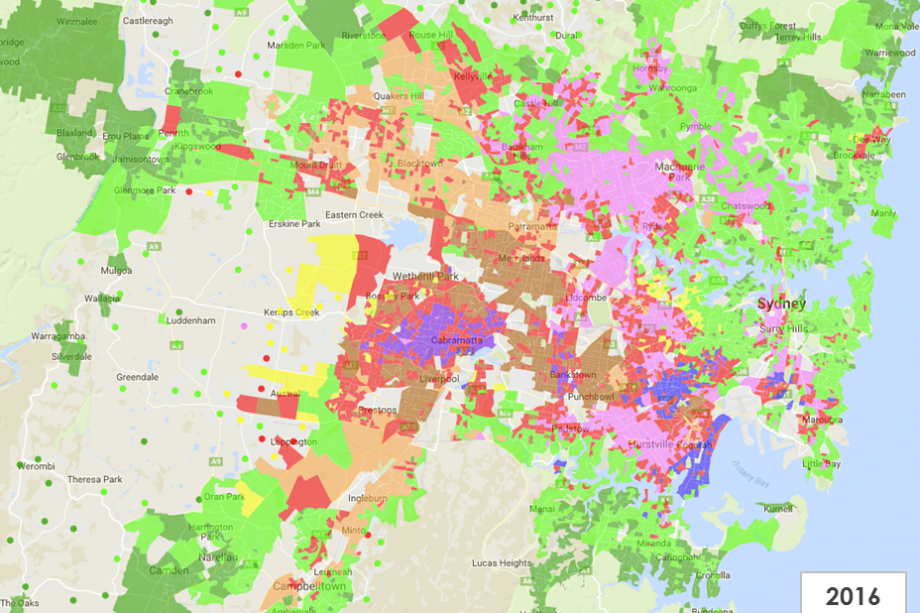
The below slider-maps compare 2011 SA1 Culture Dimensions (left) with the updated 2016 areas (right), use the slider to compare them. Non-urban SA1 areas are represented by a dot. Maps should be viewed in a web browser.

Sydney
Chinese Influence (pink) areas have become more distinctive as lower North Shore hotspots spread out further, particularly along the Pacific Highway into Chatswood. Castle Hill and Hornsby have gone from Caucasian (green) to Chinese influence.
South-Asian (orange), whose growth has largely come with Indian immigration, have extended with new housing developments and predominantly in Western Sydney. Multicultural areas, such as Blacktown and North Parramatta, that were previously less discerning now have a clear South-Asian Influence.


Melbourne
This traditionally strong Greek and Italian city would historically have been green, blue and yellow, with a purple growth westwards from the 70’s & 80’s due to the influx of Vietnamese immigrants. However, replicating the nationwide trend, these localised population clusters have generally not been replenished and become relatively diminished.
Like Sydney, the notable growth has been an expansion of Chinese Influence in previously Caucasian areas, and South-Asian playing a key part in urban expansion in the big housing development areas on the city fringe.
Urban development in the CBD, particularly in proximity to the universities, has resulted in expanded areas of Chinese Influence.


Brisbane
The trends of Sydney and Melbourne have not made their way to Brisbane as it remains largely Caucasian. However there are pockets appearing in new areas of housing development. Sunnybank remains a hub of Chinese Influence, and there is evidence of a minor expansion of non-Caucasian within other pockets of the city.

