
While Australia’s population growth attracts significant public attention, local-level data reveals a more complex picture than national figures suggest. Every year, the Australian Bureau of Statistics (ABS) releases the Estimated Resident Population (ERP) data, providing a detailed snapshot of population changes across the nation. By combining the yearly ERP reports from 2021 to 2024 and using the geoTribes Explorer location intelligence platform to analyse and visualise the results, we’ve uncovered the market-shaping trends that are impacting Australia’s capital cities and regional areas.
Understanding the Data Framework
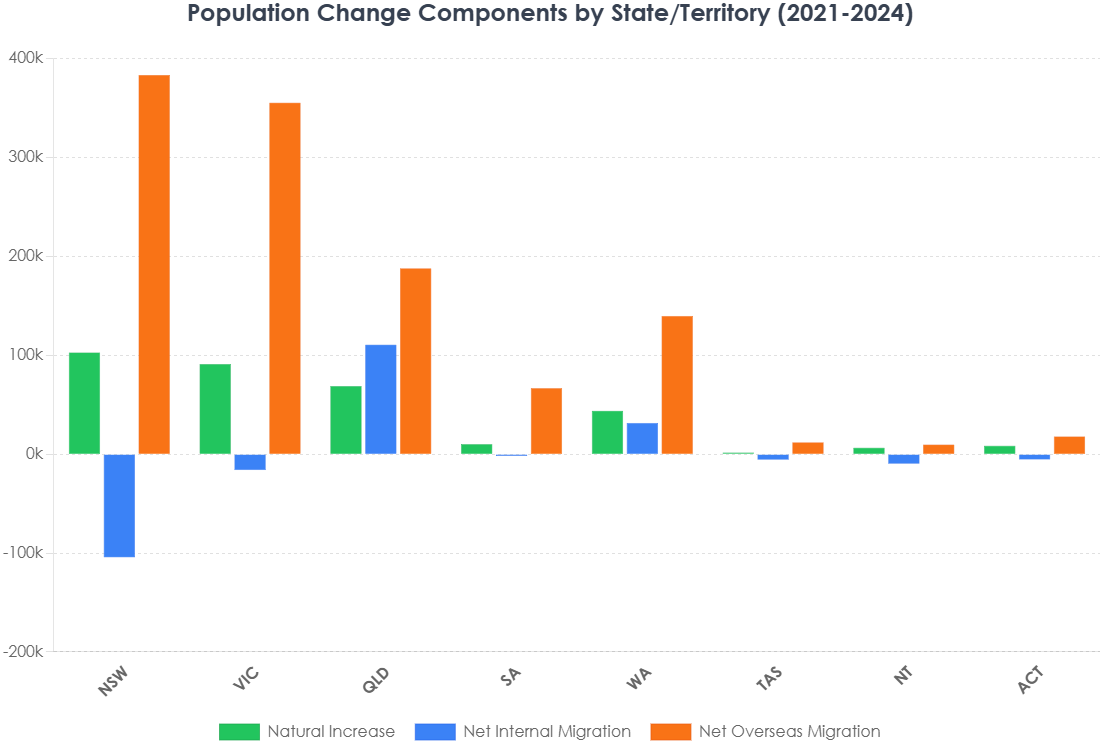
The ABS records three sources of population change:
Natural Increase is the most predictable form of growth, representing the number of births exceeding deaths.
Net Overseas Migration comprises arrivals and departures. Since this data is not collected at local area level, the ABS estimates local numbers using census data from 2016 and 2021, state migration records, visa statistics and international student numbers.
Net Internal Migration tracks the movement of people within Australia. While it doesn’t affect national population totals, it varies significantly between states, cities and postcodes.
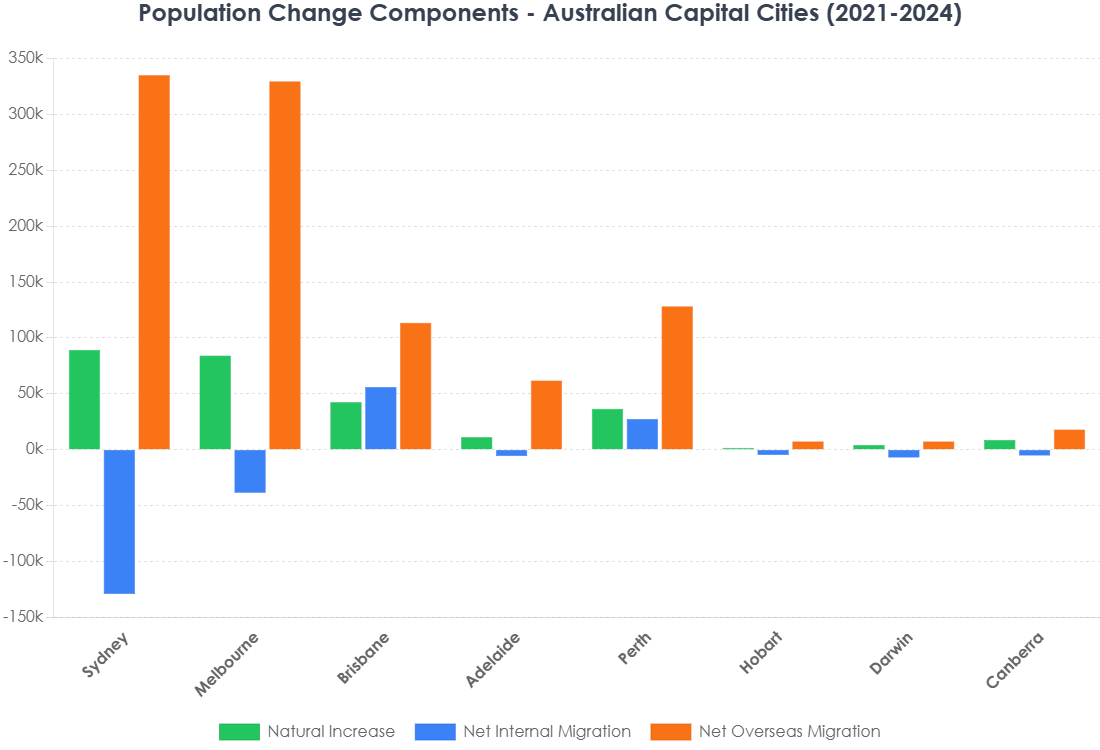
The ABS uses Greater Capital City Statistical Areas (GCCSAs) to distinguish between capital cities and regional Australia. These boundaries represent the practical extent of each capital city, though they vary considerably in size — Melbourne’s GCCSA covers a much larger area and population than Darwin’s or Hobart’s.
National Overview
From 2021 to 2024, Australia’s population increased from 25.7 million to 27.2 million, reflecting a 5.9% increase. Net overseas migration contributed 1.17 million people (78% of total growth), with natural increase accounting for the remaining 335,000.
In addition to the ABS data, RDA Research’s geoFusion model was utilised to capture the growth in the number of private occupied dwellings for each postcode in the same timeframe. The number of such dwellings increased from 9.4 million to 9.9 million — a 5.3% rise. While not all residents live in private dwellings, comparing population growth to private dwelling growth provides a relative indicator of housing pressure across different areas.
There was one distinct difference in the growth seen between the capital cities and Australia’s regional areas: net internal migration. While capital cities experienced population growth of 1.17 million people (6.8%) compared to 336,000 (4.0%) in the rest of the country, there was a net outflow of more than 107,000 people leaving the cities to establish themselves in regional areas.
Sydney: High Growth, High Outflow
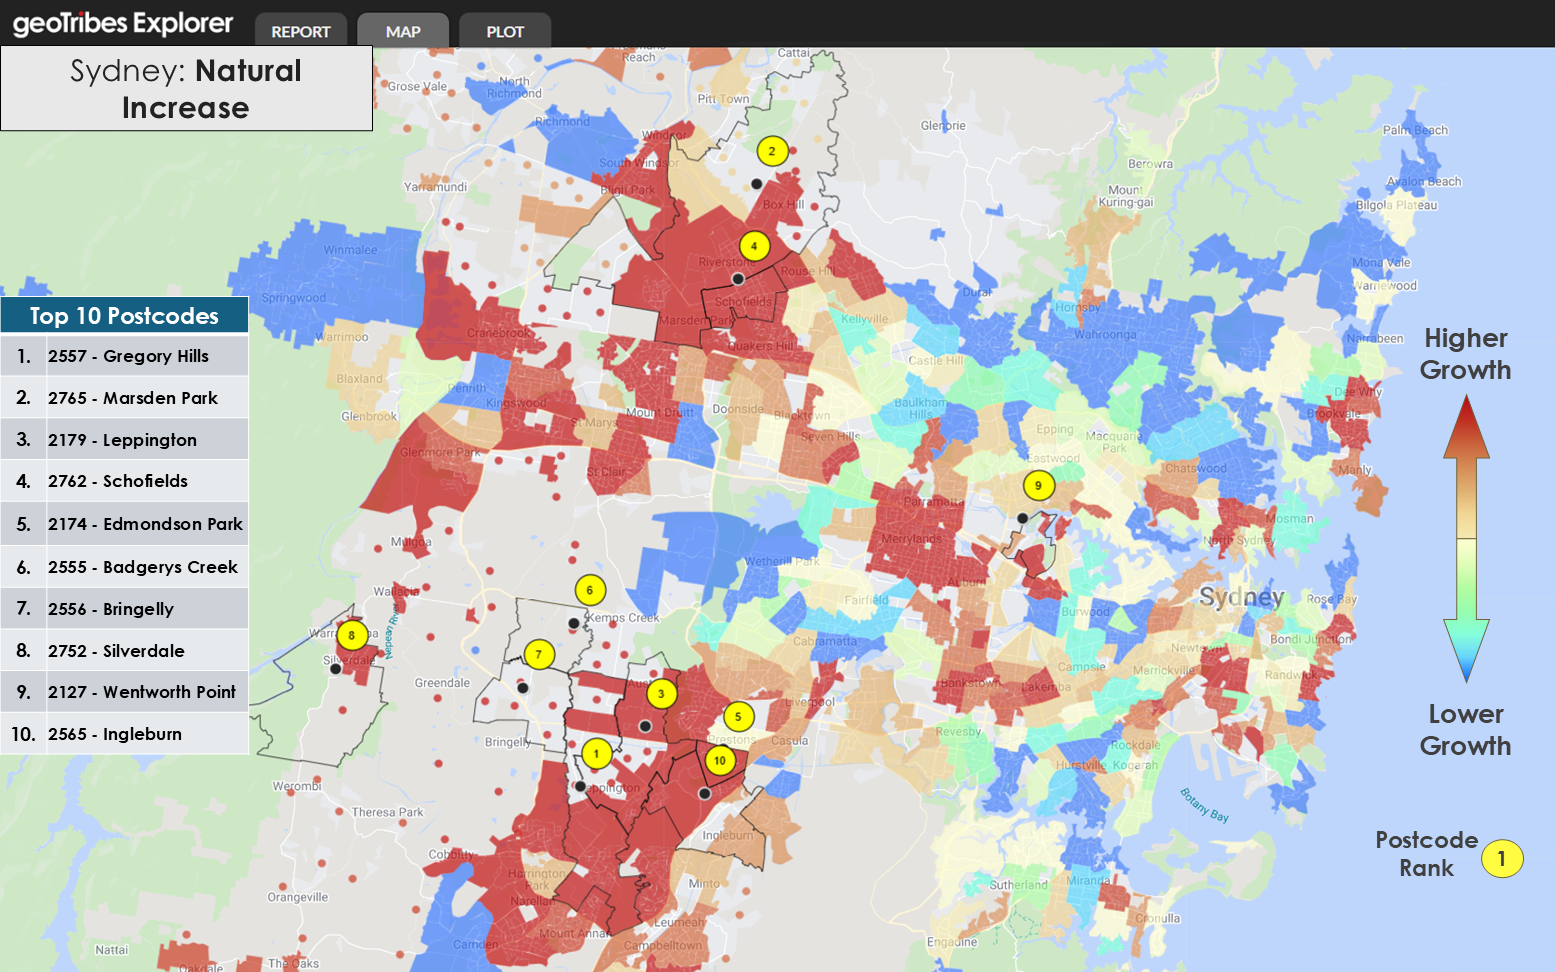
Sydney’s population increased by 295,432 (5.6%) from 5.26 million to 5.56 million, slightly under the nation’s average growth. Overseas migration was the greatest contributor to this growth, with a net gain of 335,390 people. Natural increase added 89,365 to the population, while there was a net loss of 129,323 residents due to internal migration — more than three times larger than any other city.
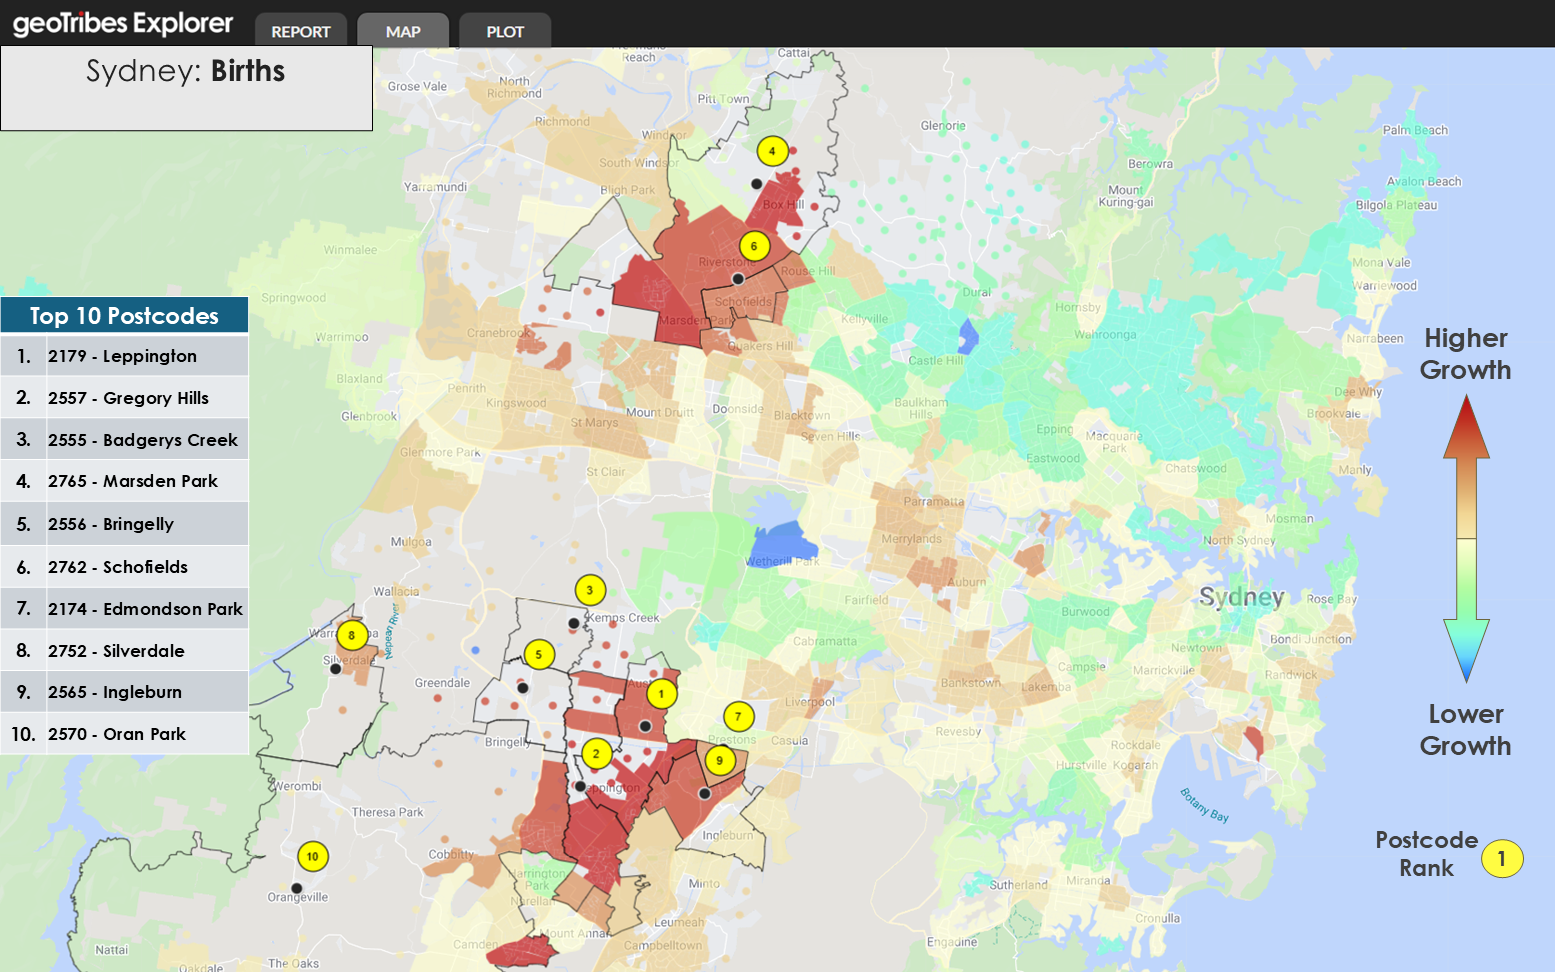
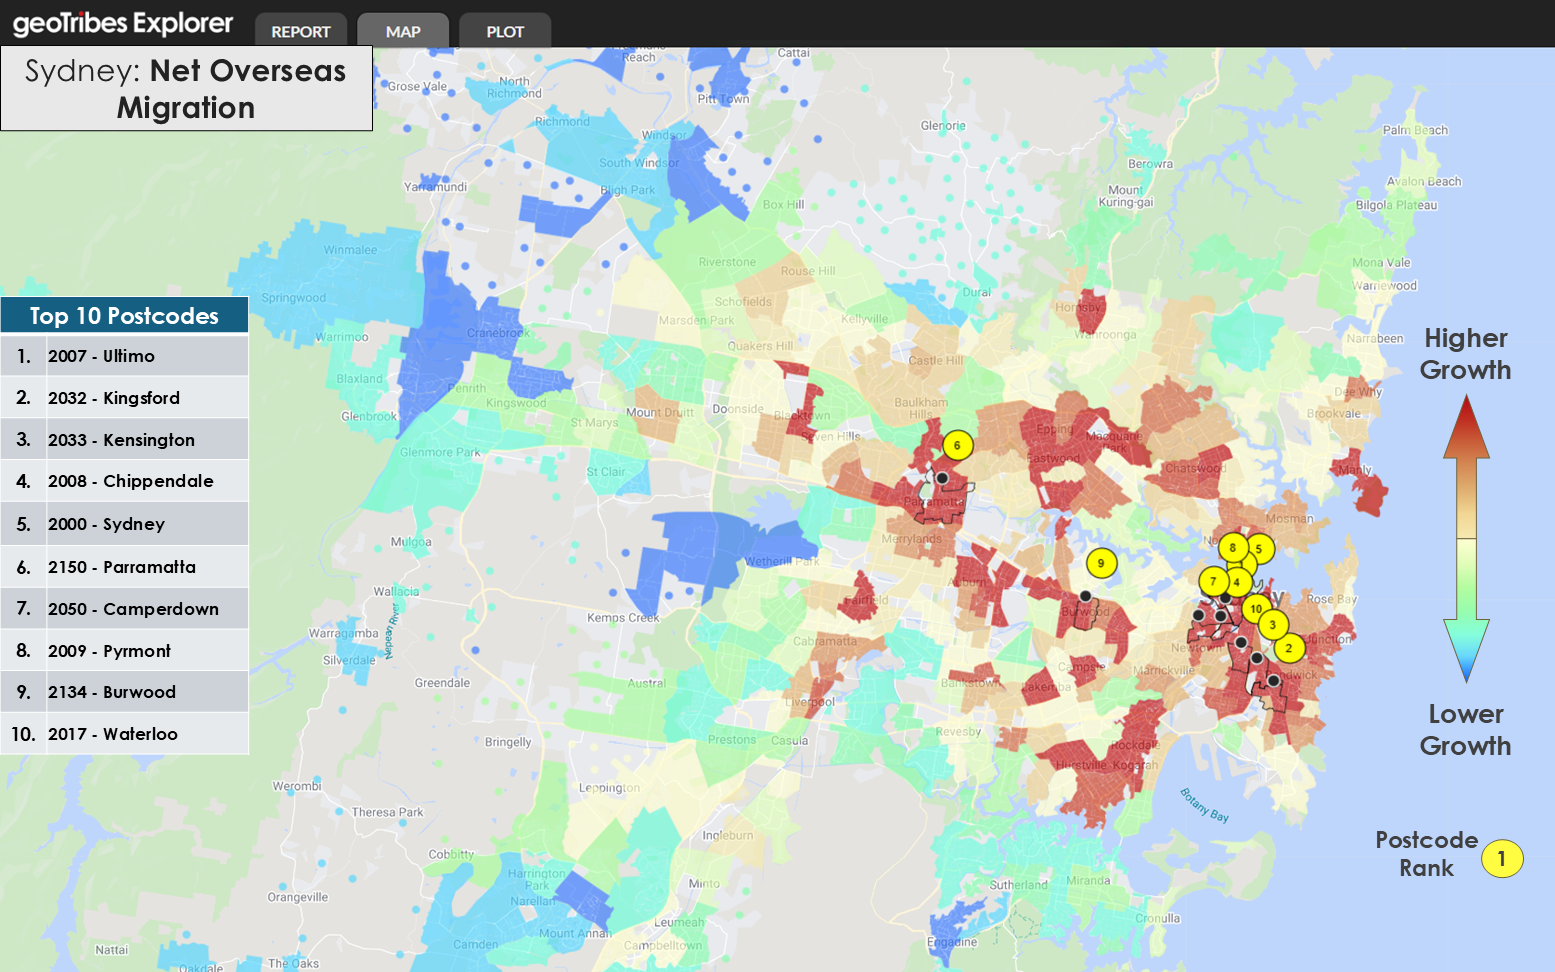
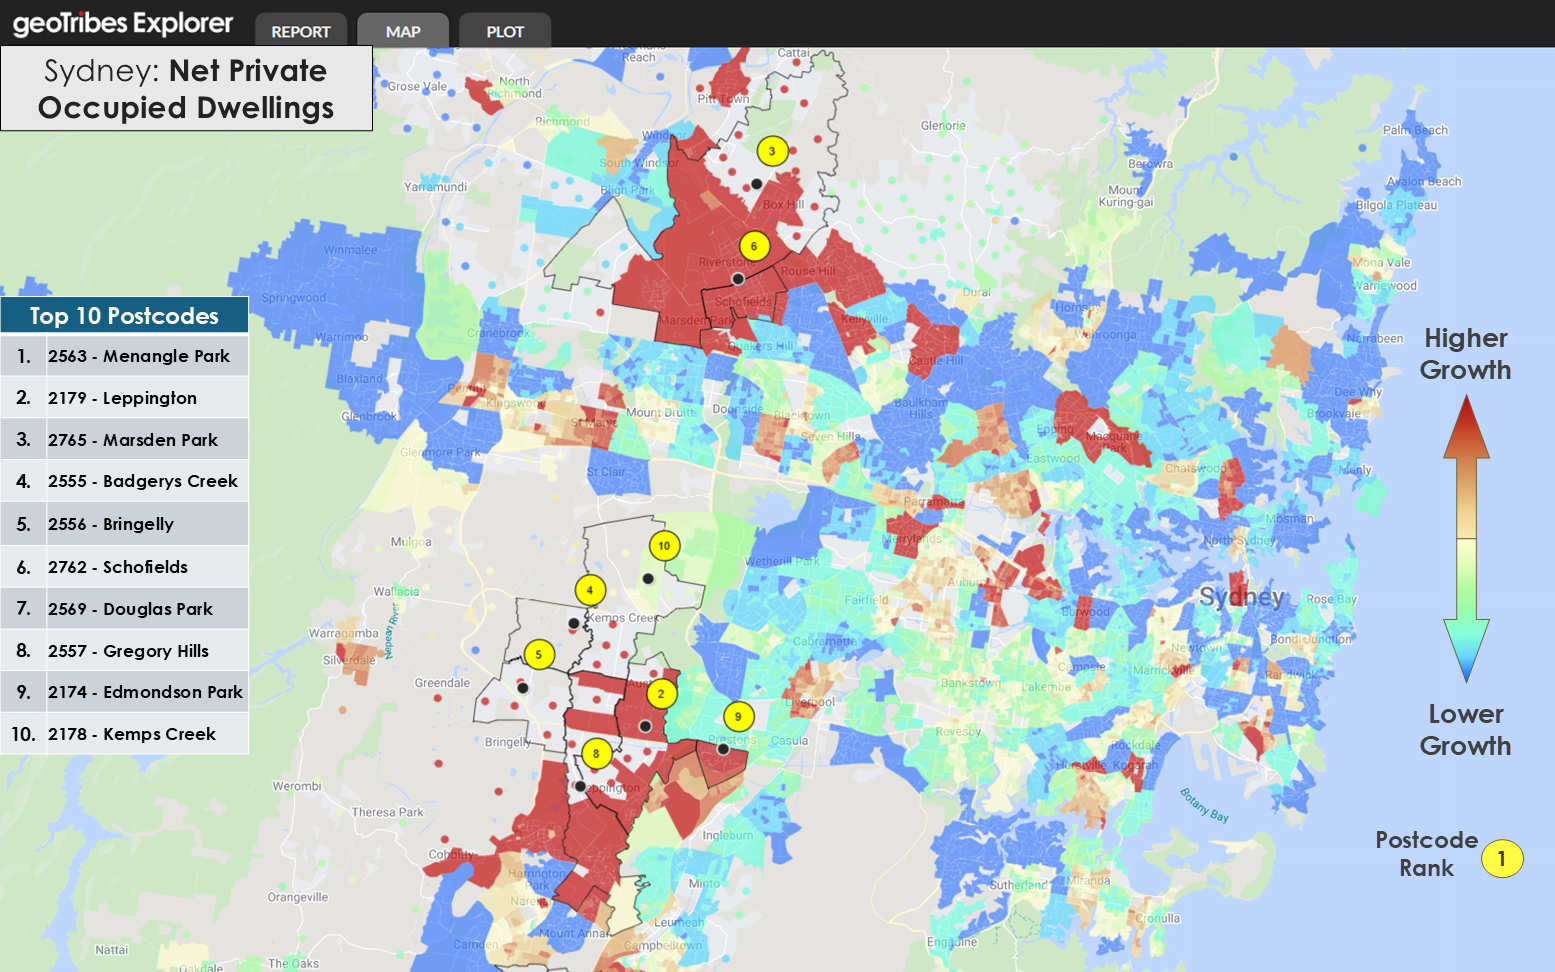
Growth was concentrated in three regions: the north-west, south-west, and inner-city areas. Growth in the north-west and south-west was driven by internal migration while displaying high rates of new housing developments and birth rates. This suggests that many of those already established in the city were moving to these new homes to start families. In contrast, inner-city growth was primarily driven by overseas migration, particularly near university campuses.
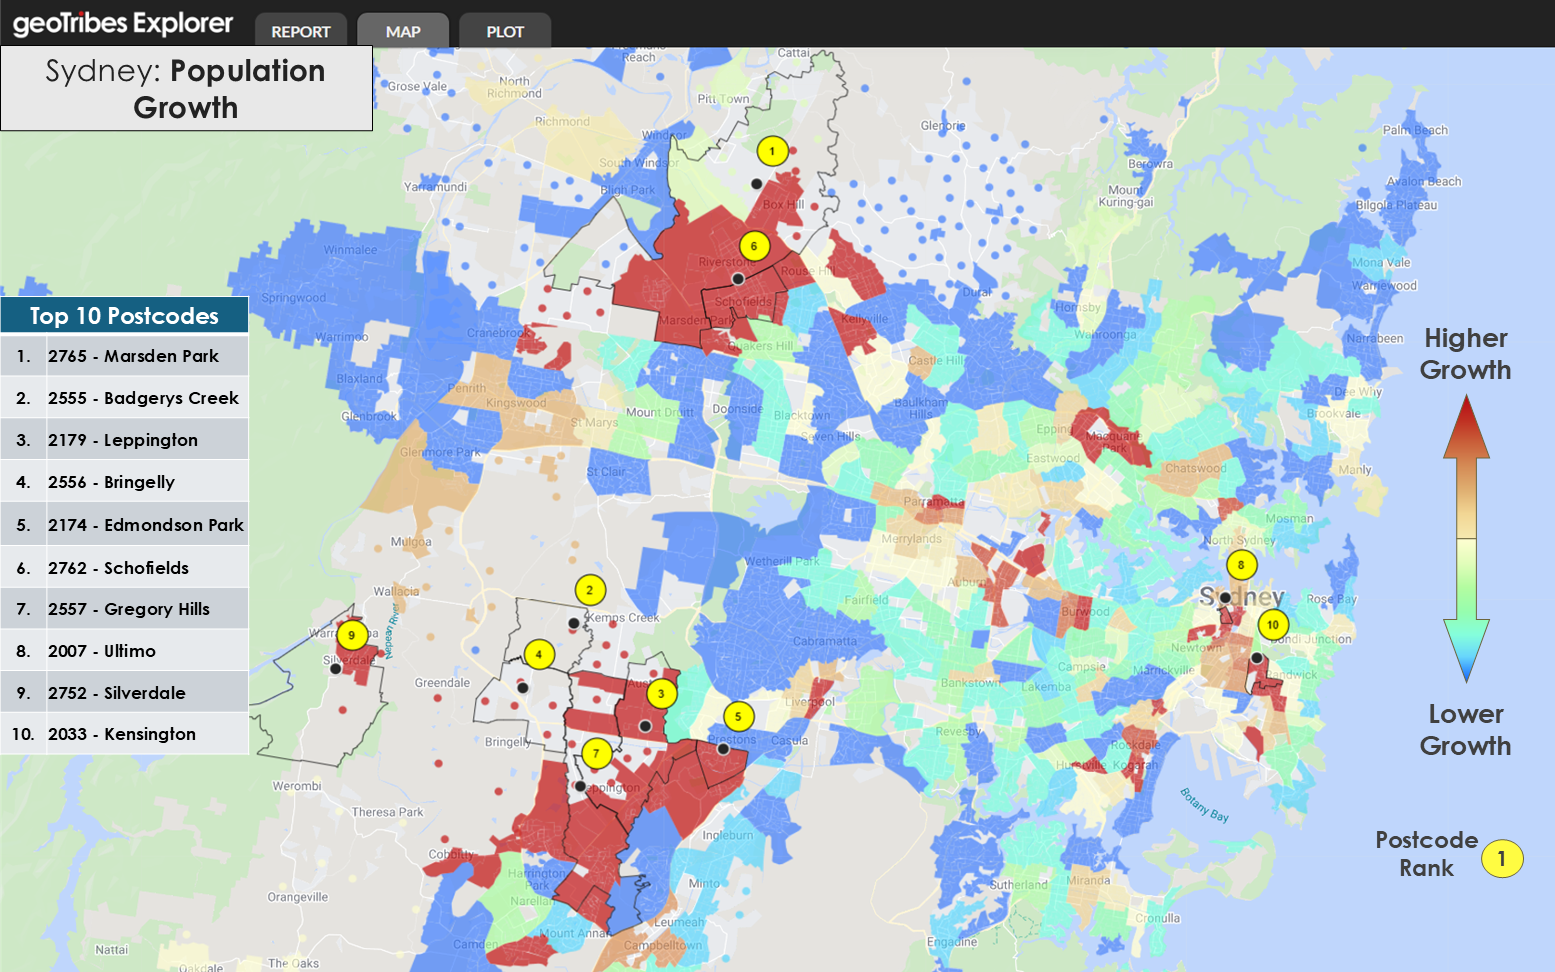 A heatmap of population growth, calculated as a percentage increase from 2021 ERP. The ten postcodes with the greatest percentage increase in population are highlighted.
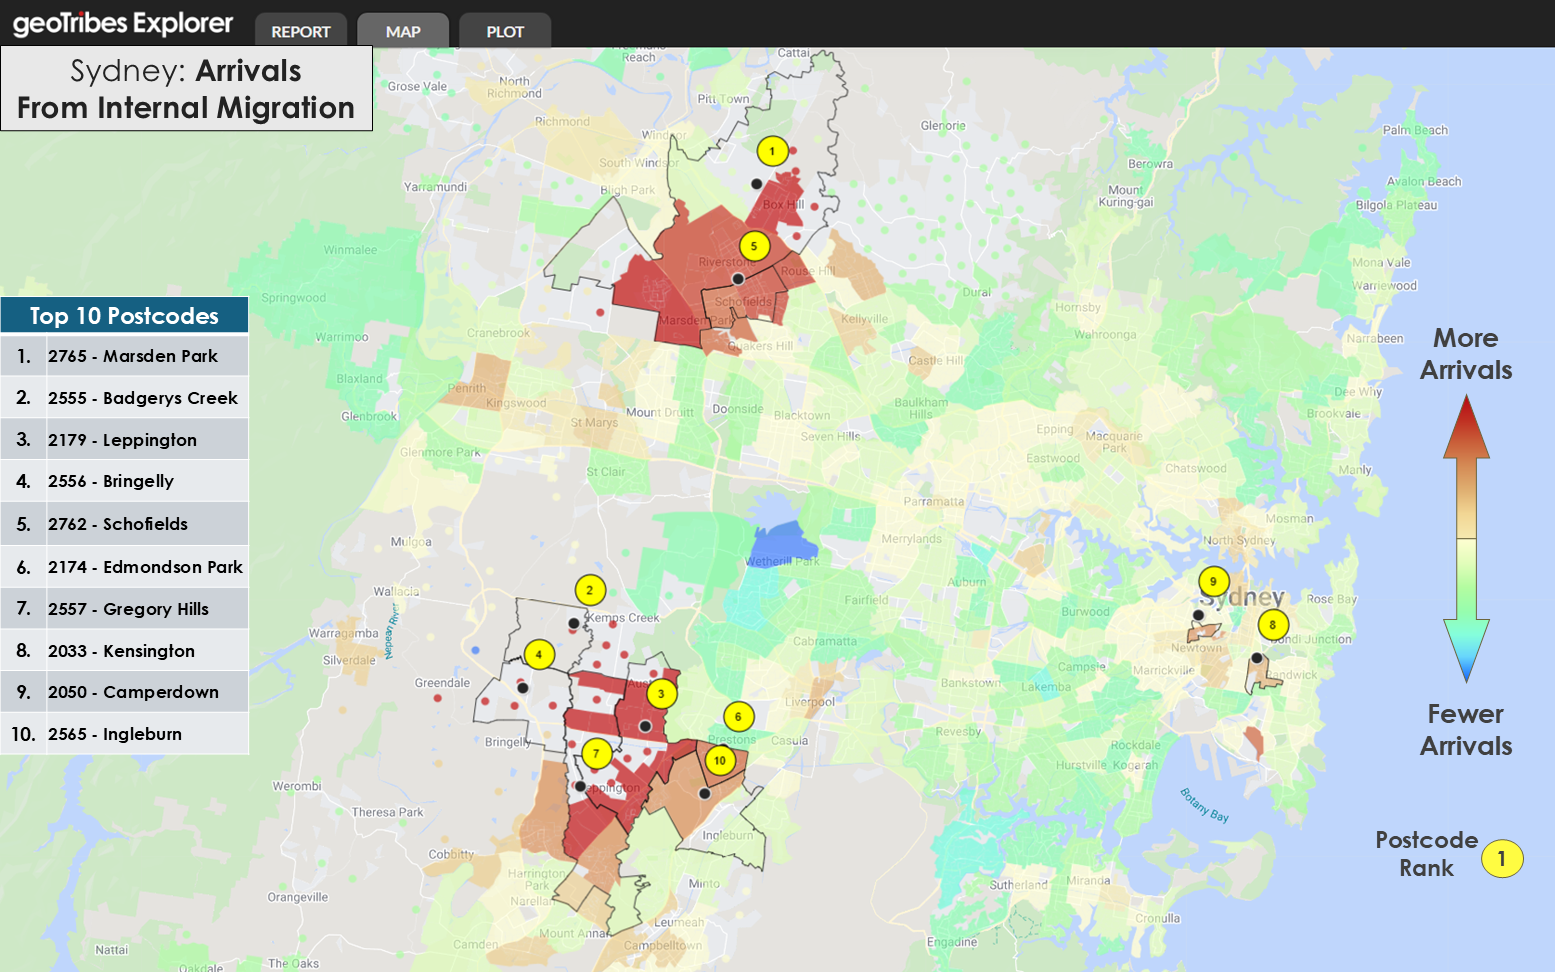
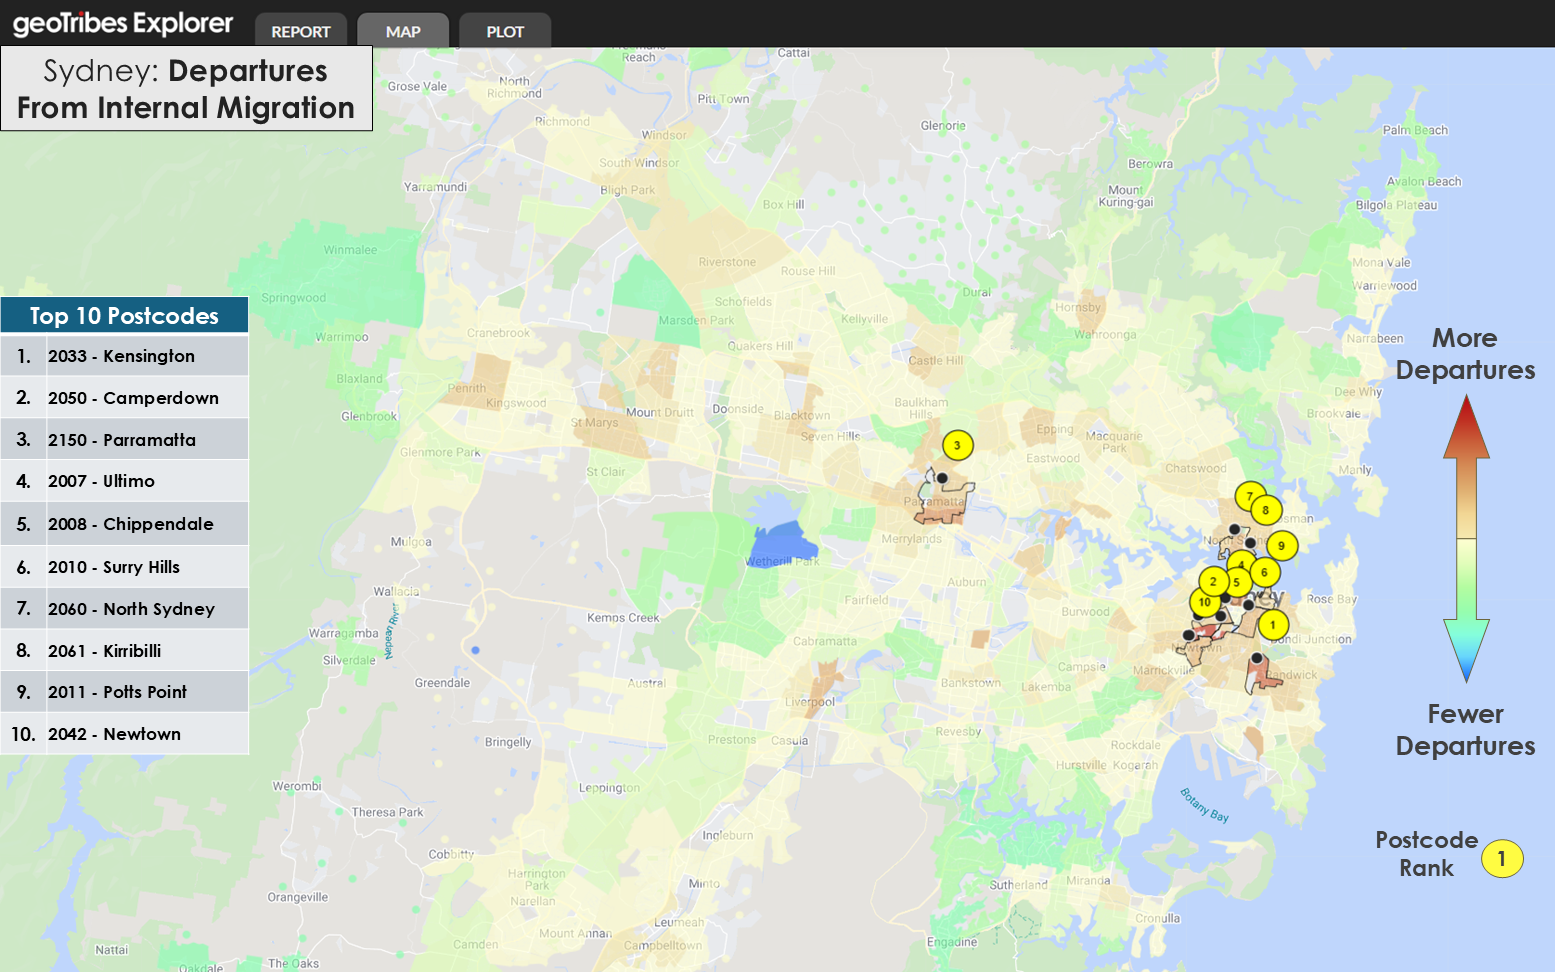
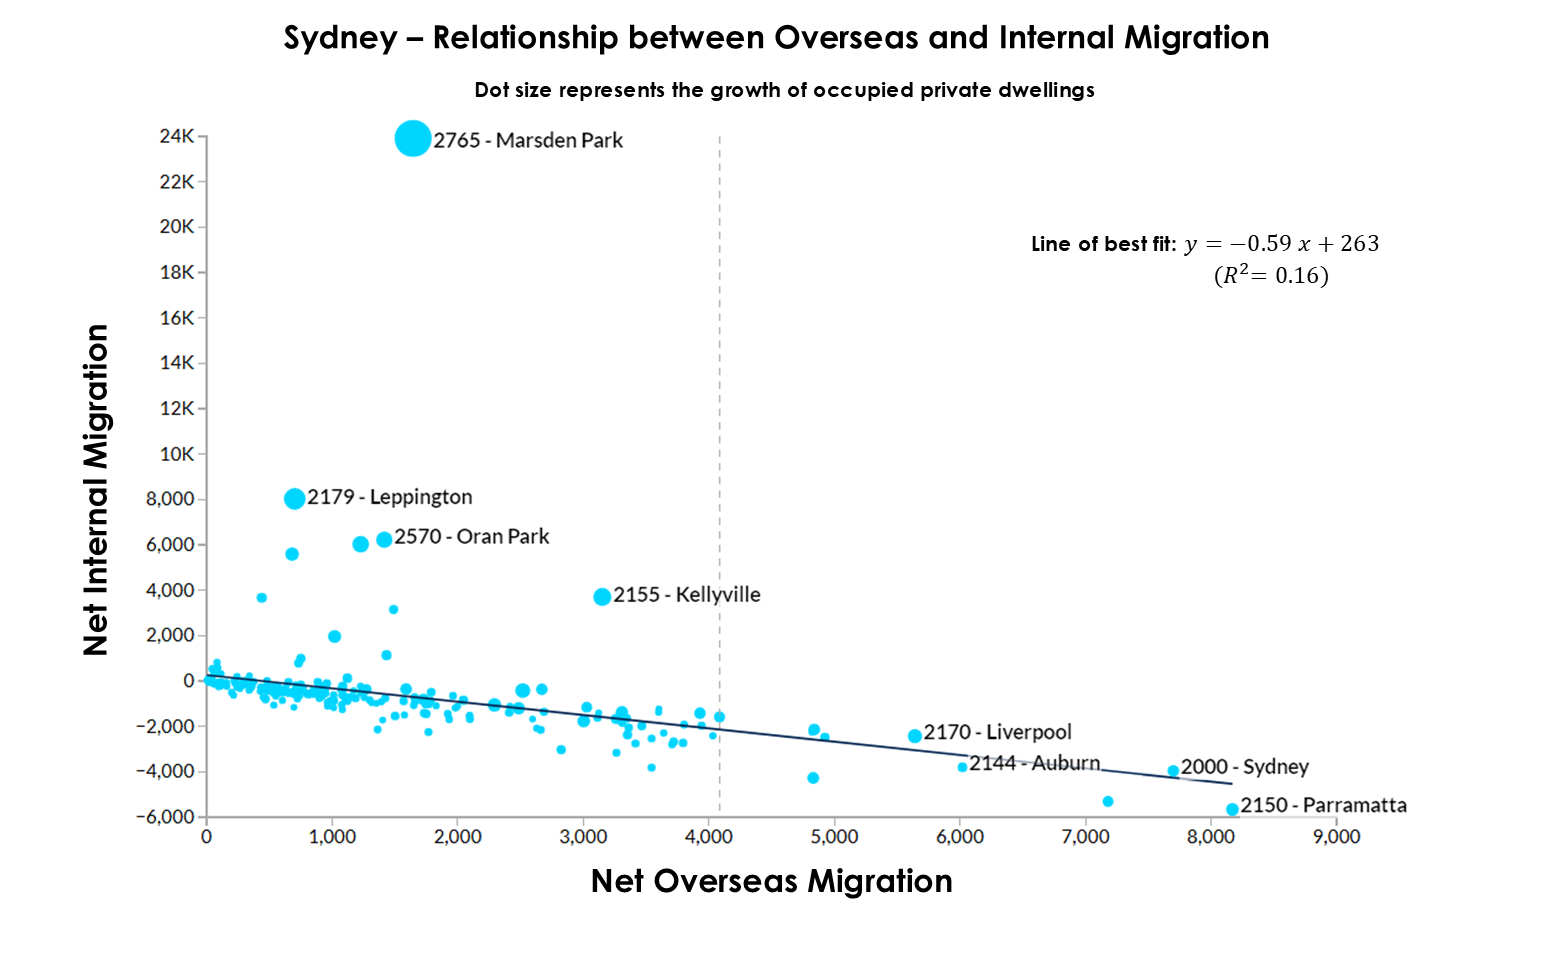
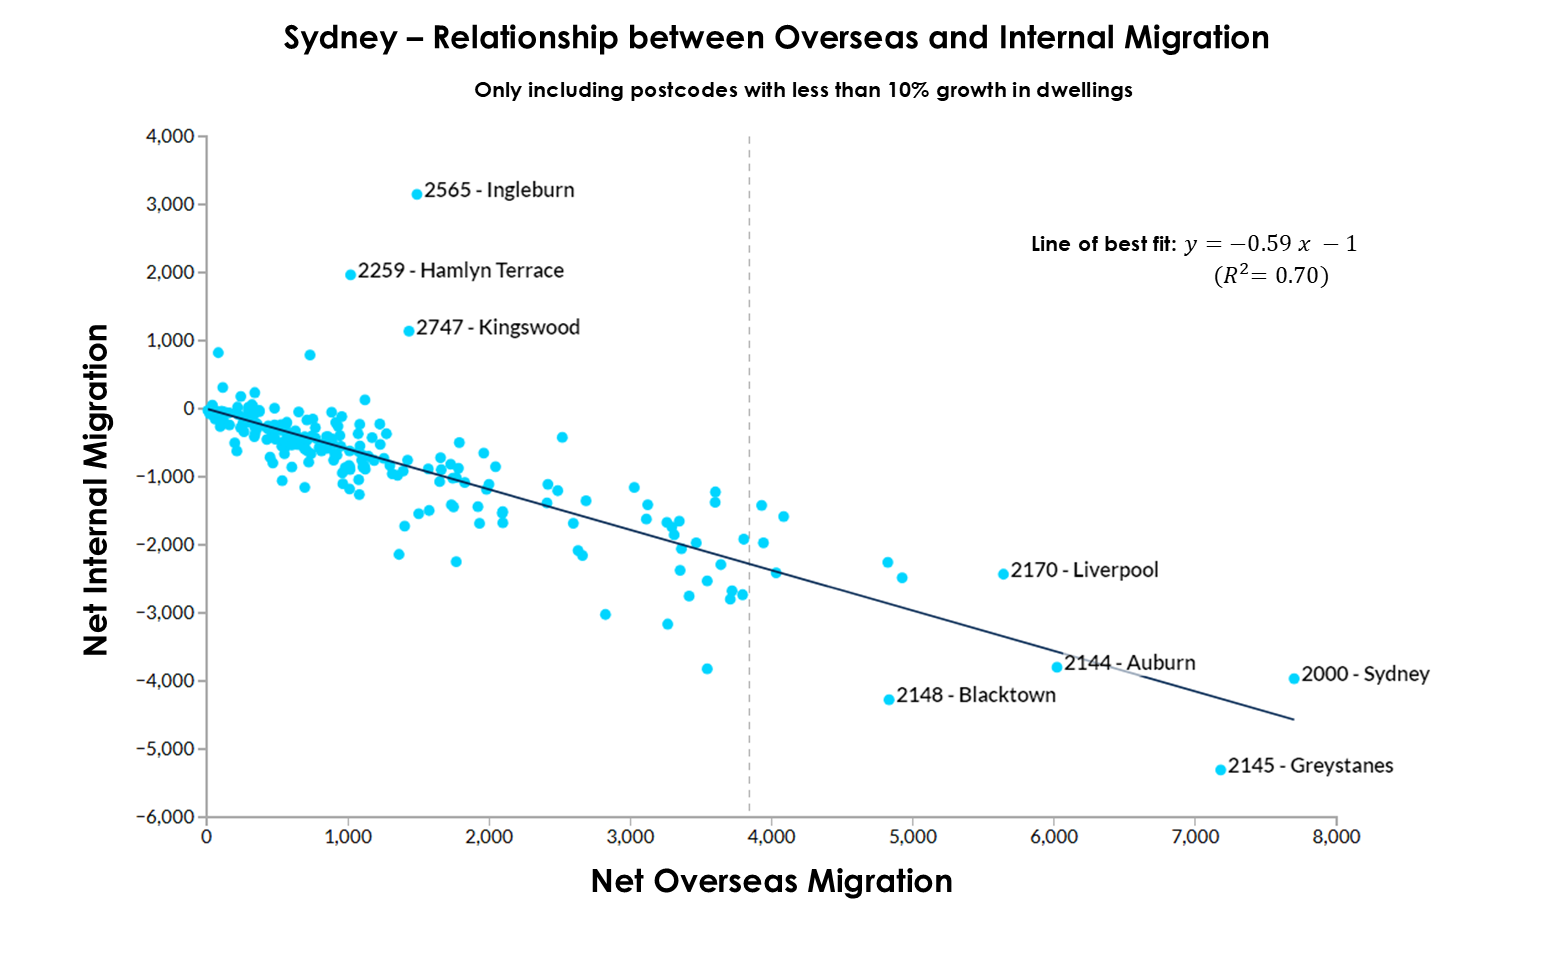
The data shows a negative correlation between overseas migration and internal migration patterns. Areas receiving higher numbers of international arrivals simultaneously experienced higher outflows of established residents, except in areas with significant new housing developments.
Sydney added 88,239 new private dwellings (4.8% growth) — less than the national average, and not enough to keep up with population growth. There were 3.35 new residents for every new occupied private dwelling, slightly below the capital city average of 3.65.
Melbourne: Australia’s Largest Absolute Growth
Melbourne recorded the largest absolute increase in population, growing by 375,386 people (7.5%) to reach 5.35 million. Melbourne’s figures for net overseas migration (329,829) and natural increase (84,266) were both very similar to those of Sydney. Only internal migration differed, with a net outflow of 38,709 residents from the greater Melbourne area.
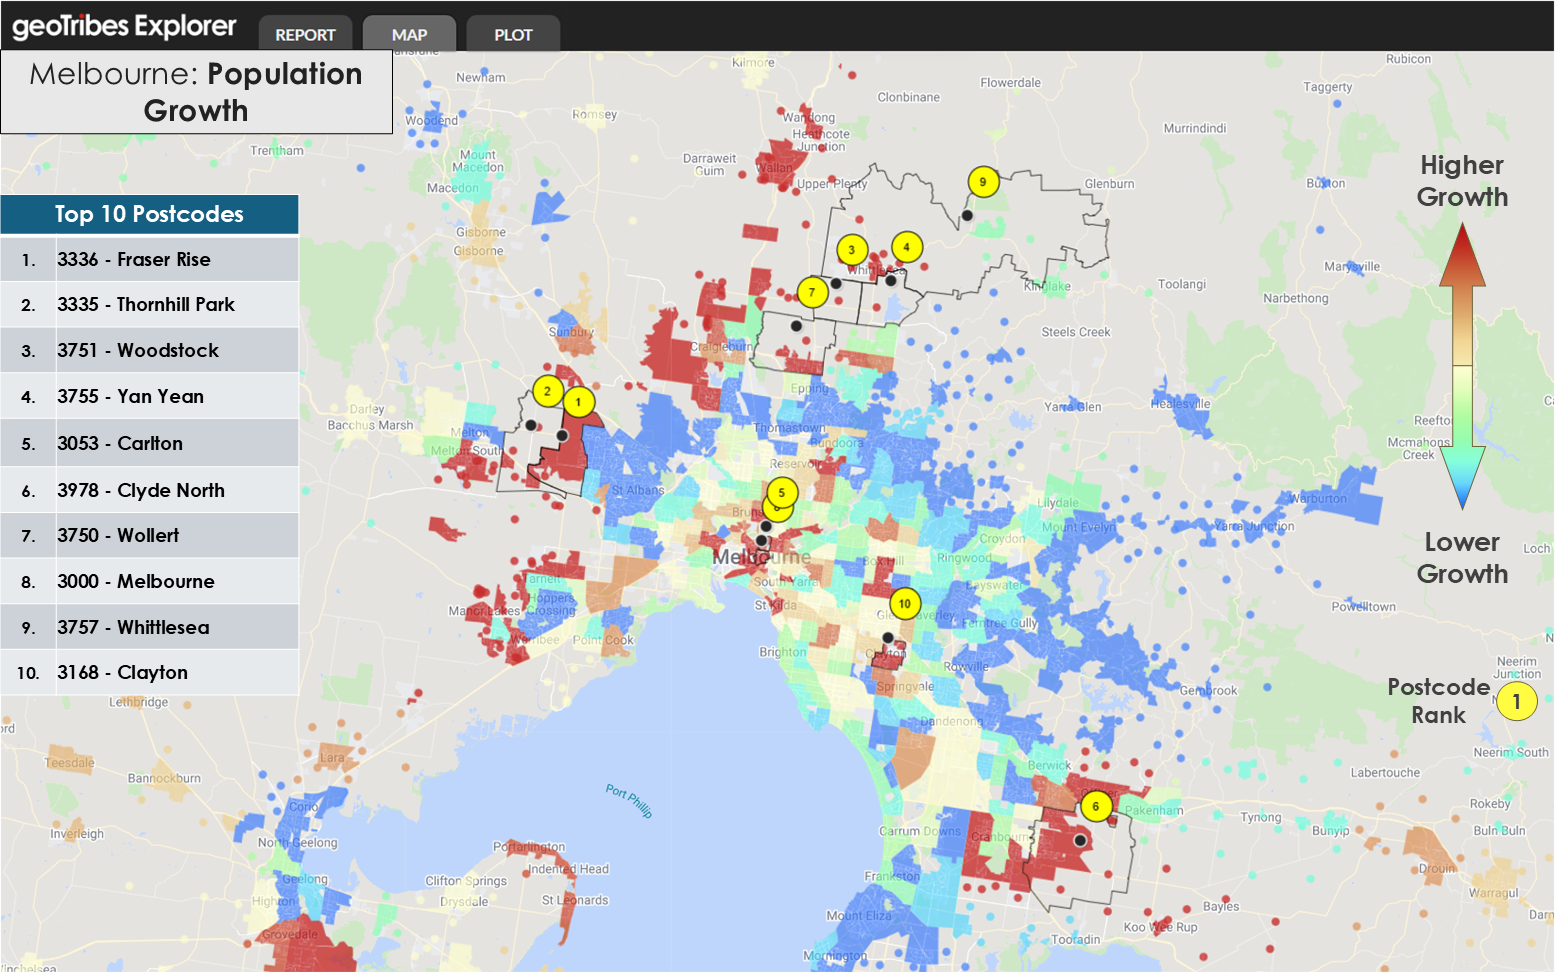 A heatmap of population growth, calculated as a percentage increase from 2021 ERP. The ten postcodes with the greatest percentage increase in population are highlighted.
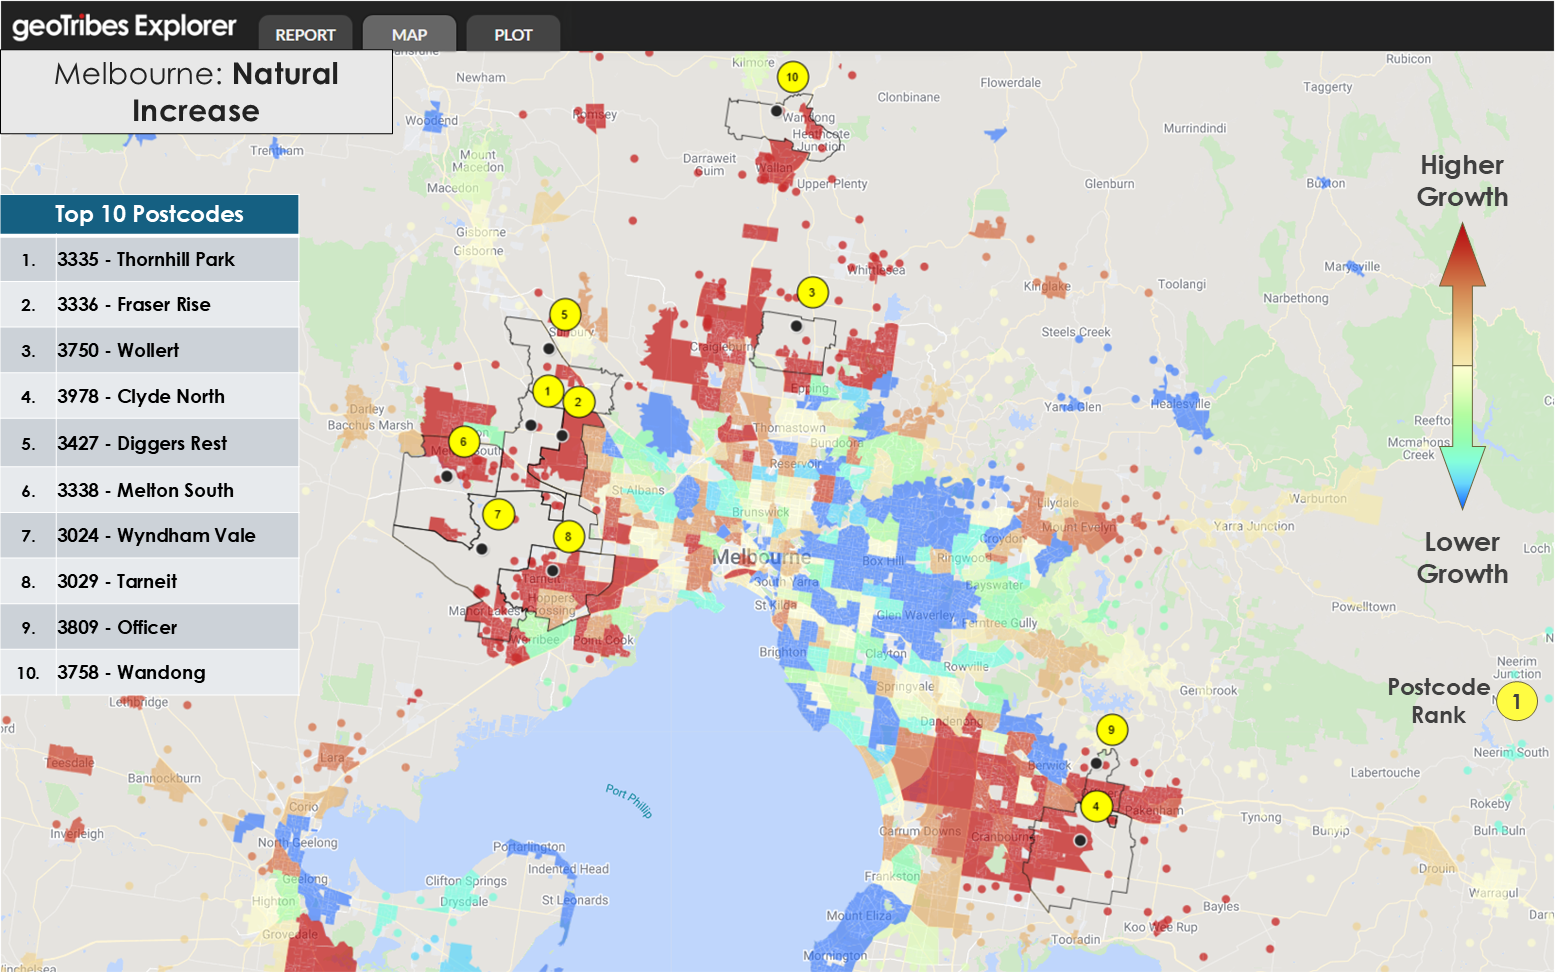

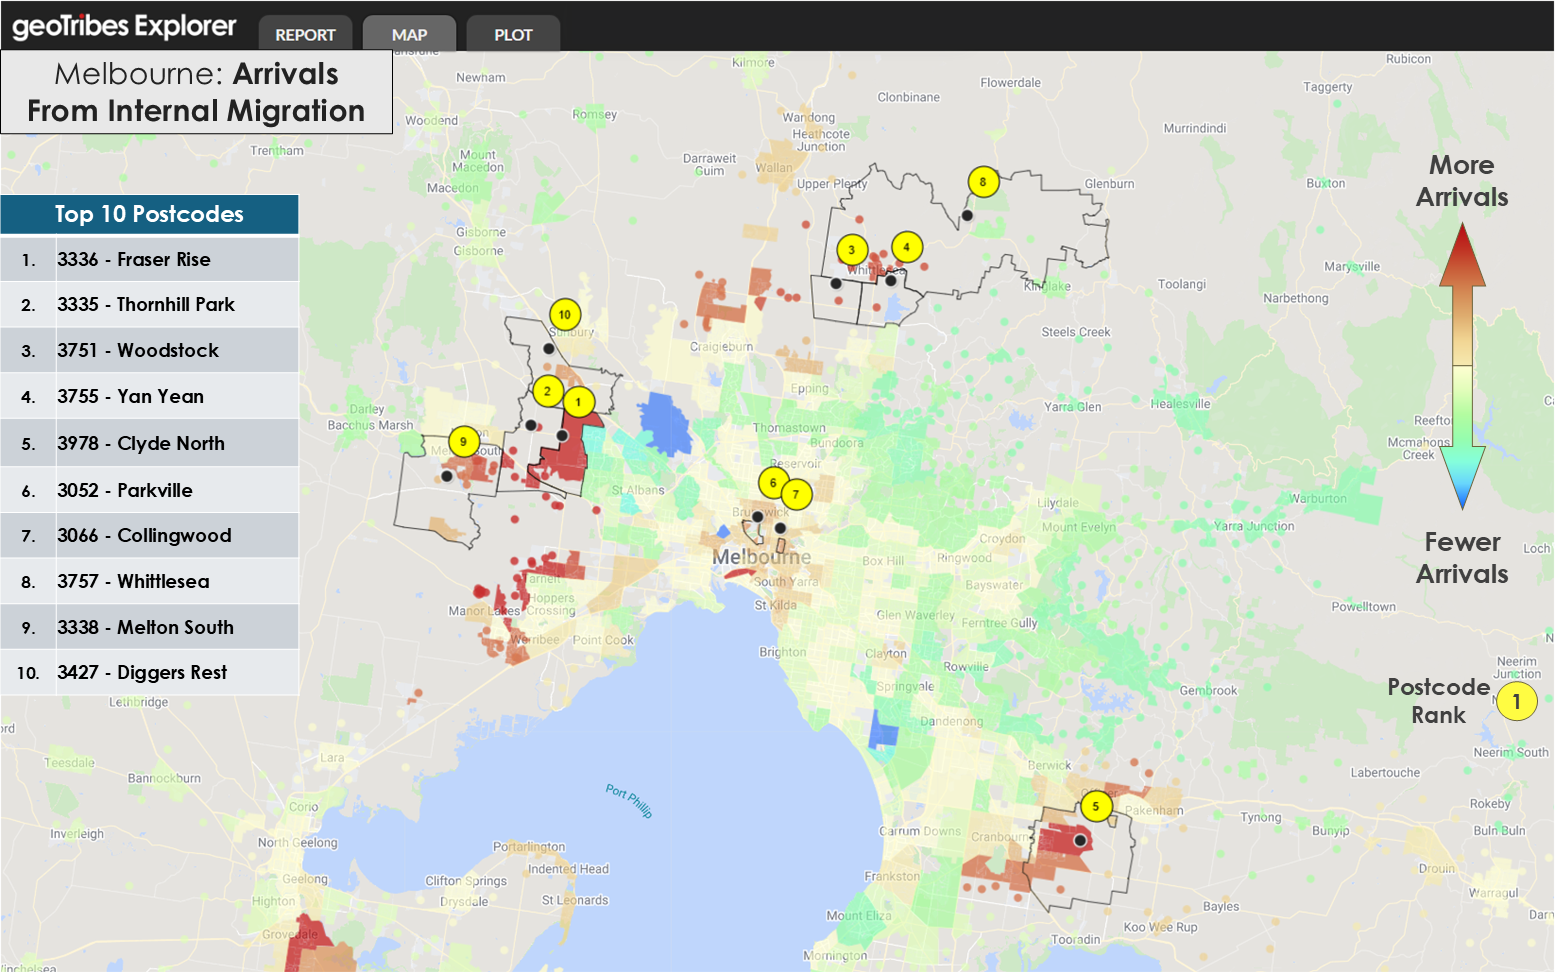
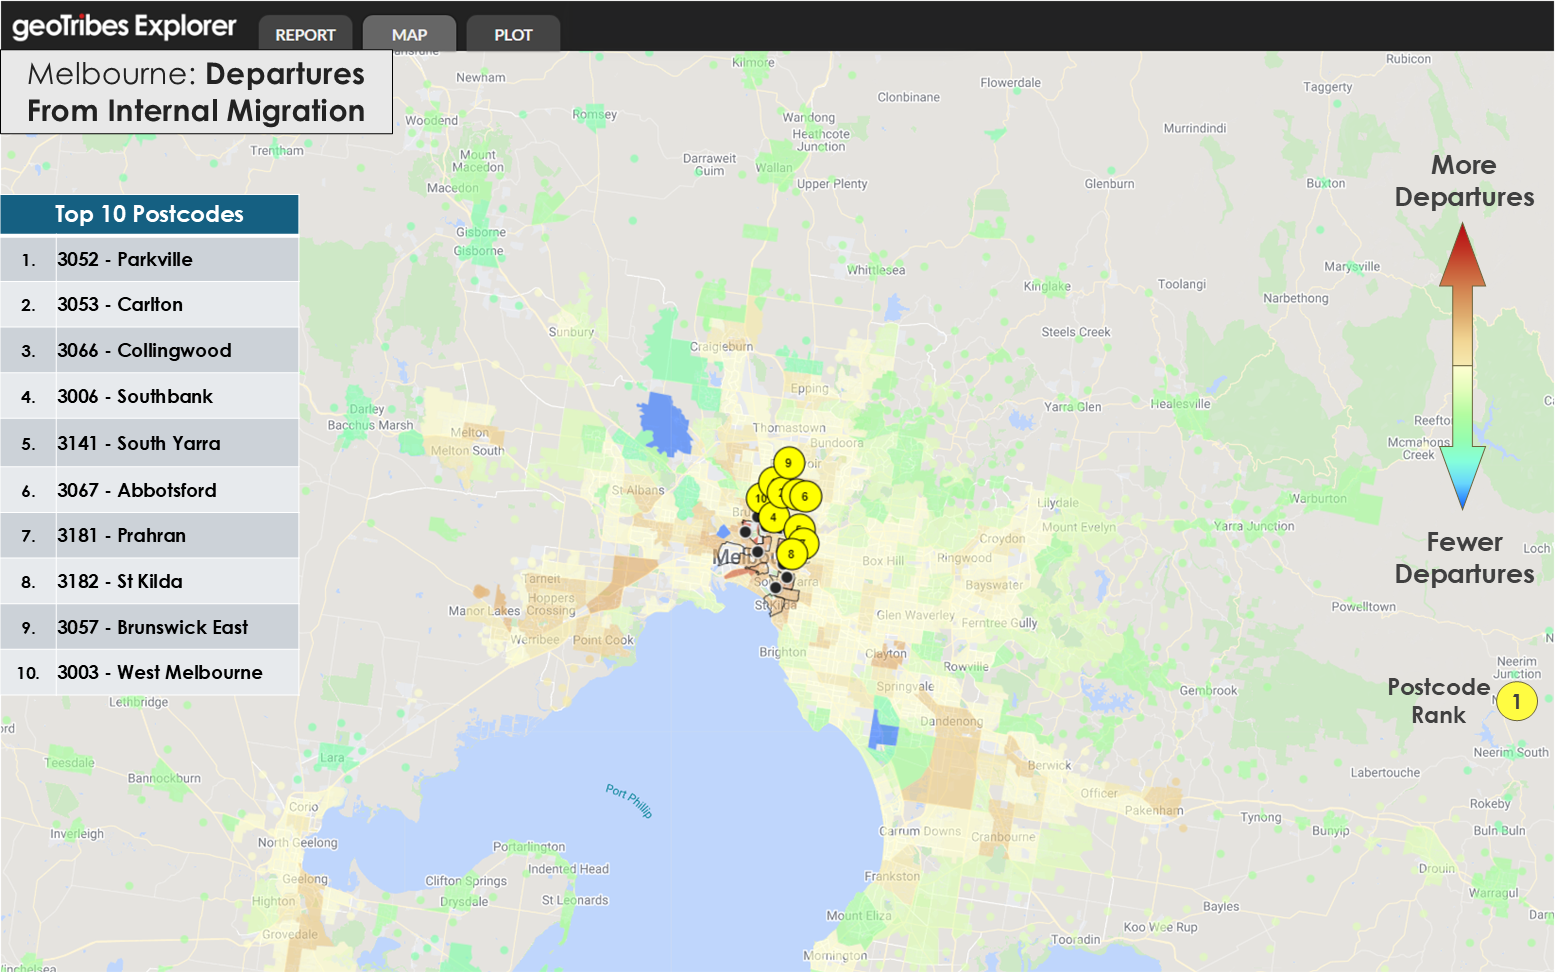
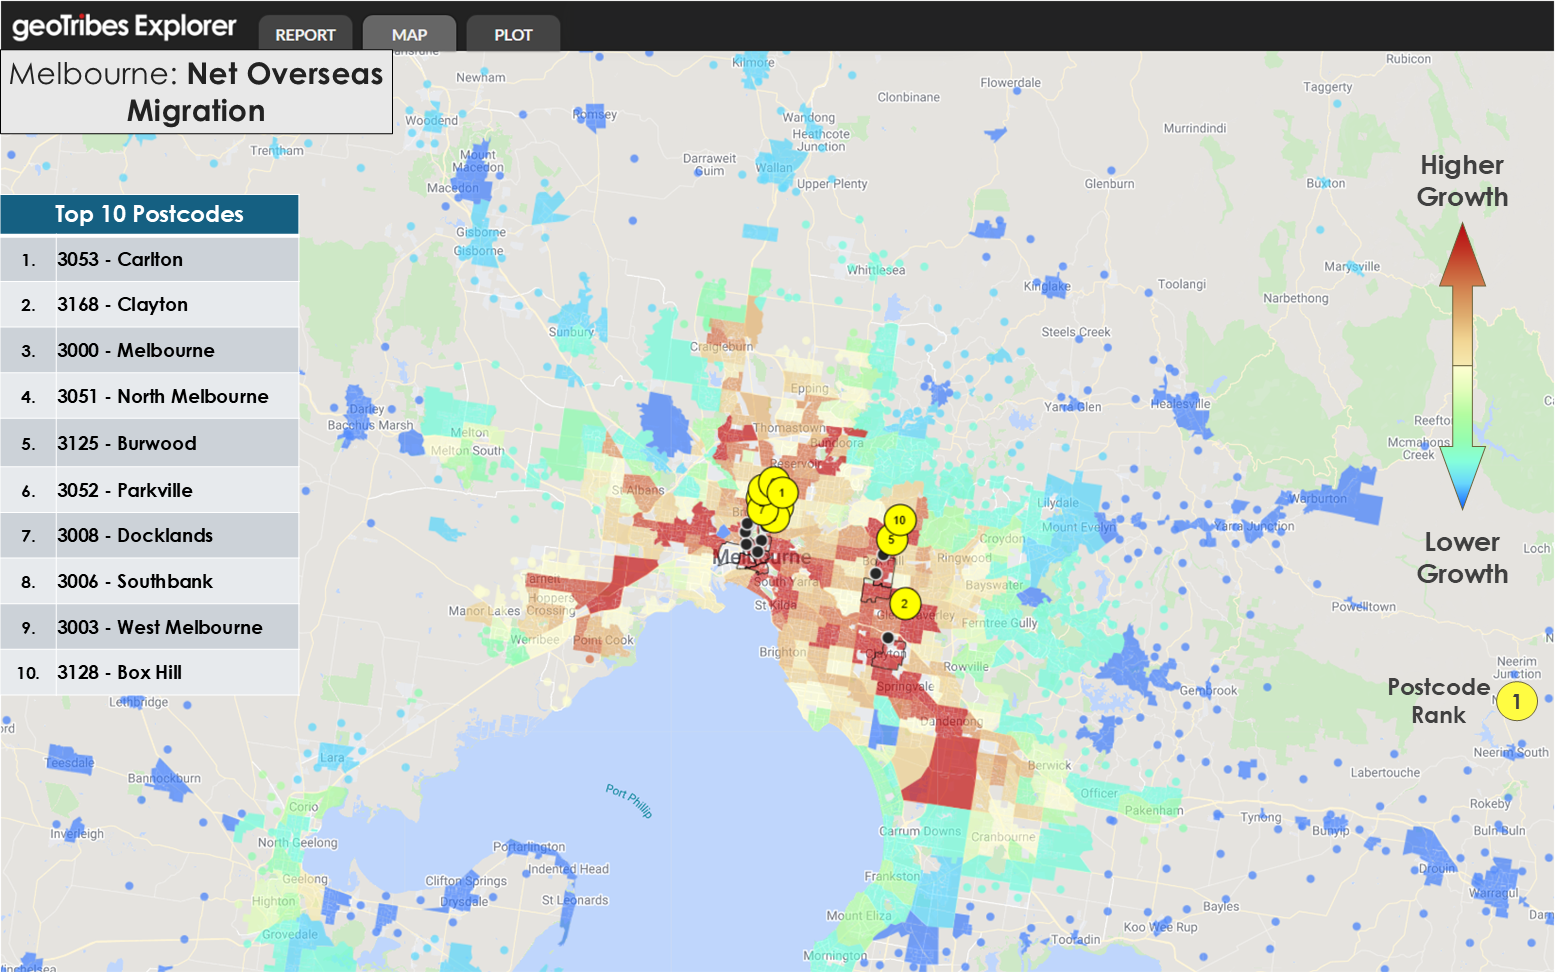
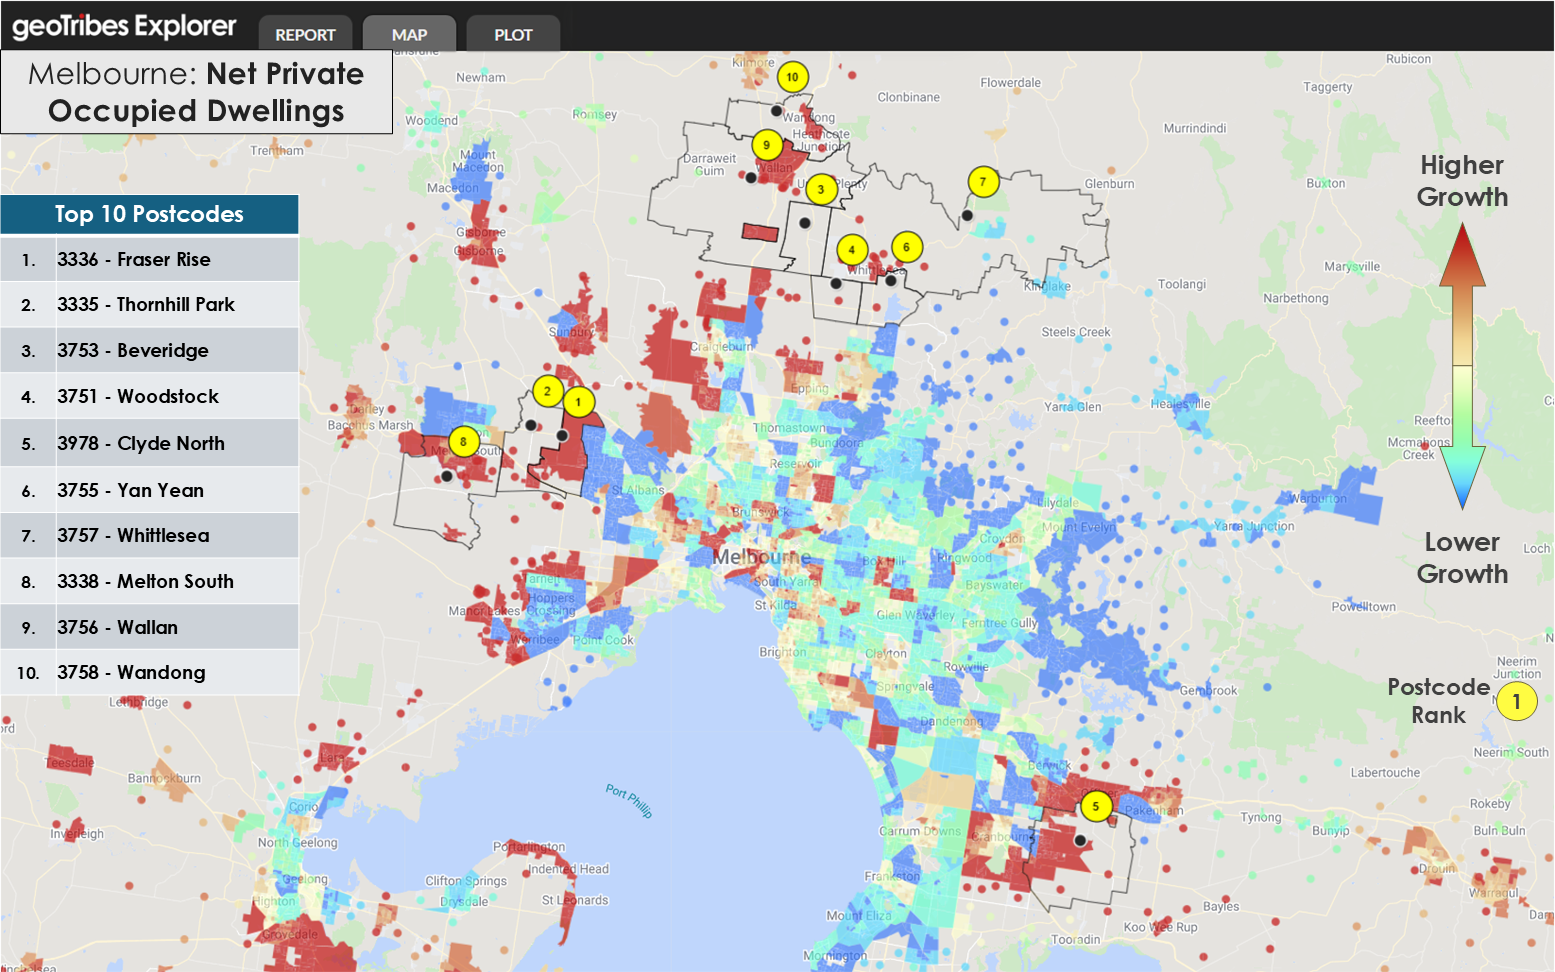
Growth was unevenly distributed, with the inner city and the outskirts yielding the greatest increases by percentage. Similarly to Sydney, growth on the outskirts of the city was due to internal migration, again associated with new housing developments and higher rates of births. Melbourne was home to the postcode with the greatest percentage increase: Fraser Rise, which almost doubled its population in the three-year period. The main factor for growth in the inner-city was overseas migration, with many of the postcodes recording the highest percentage growth being situated near university campuses.
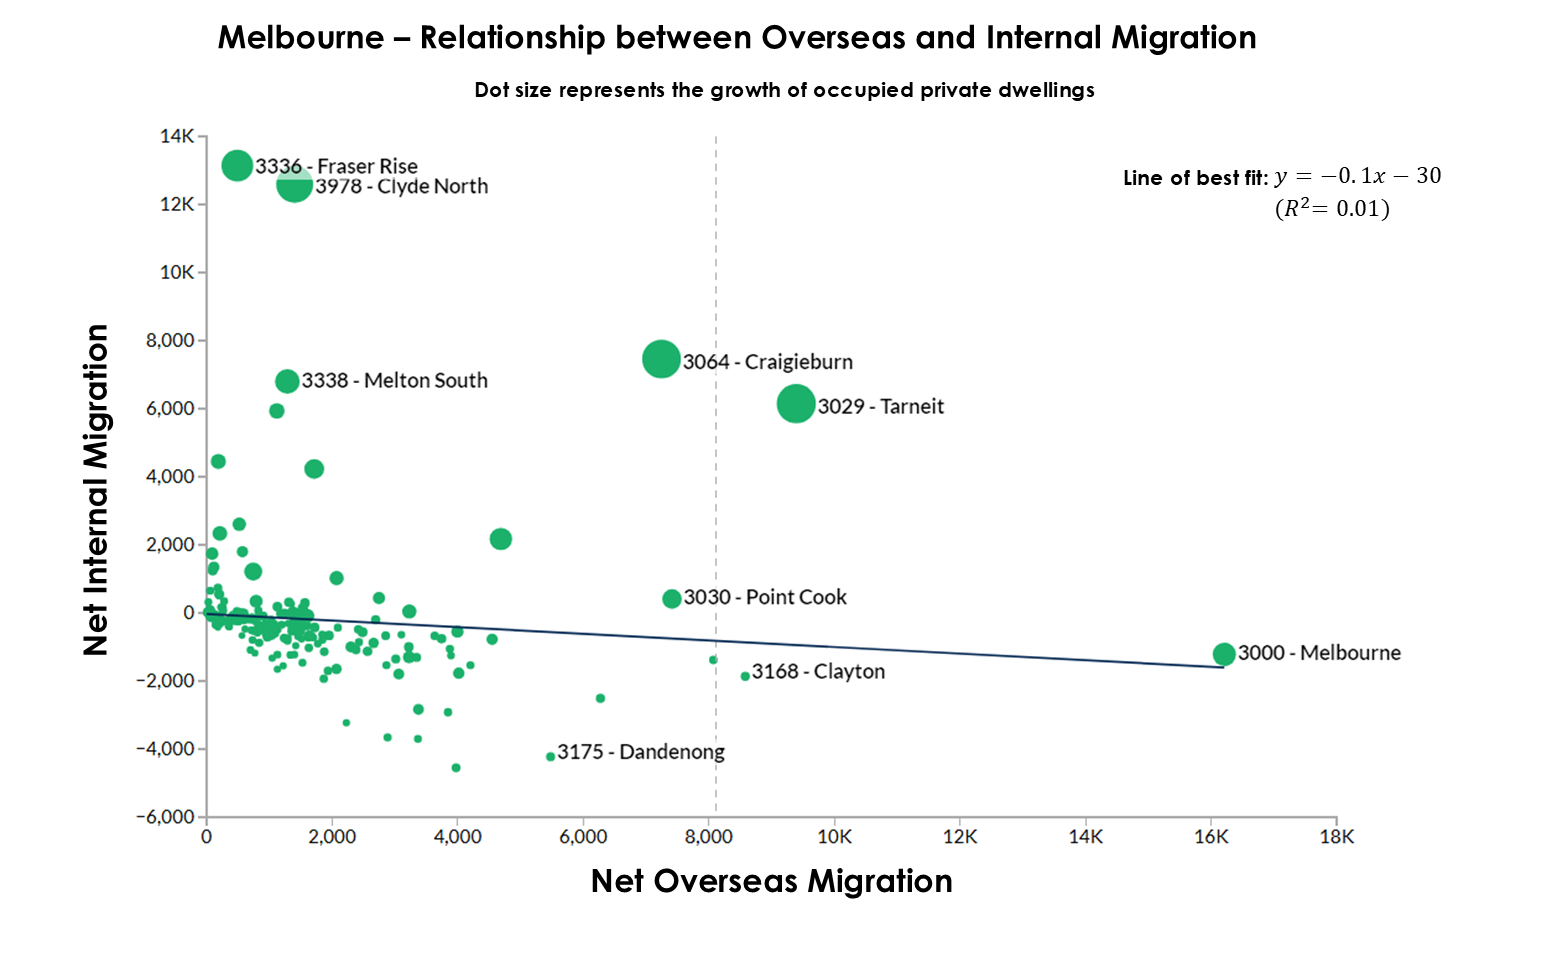
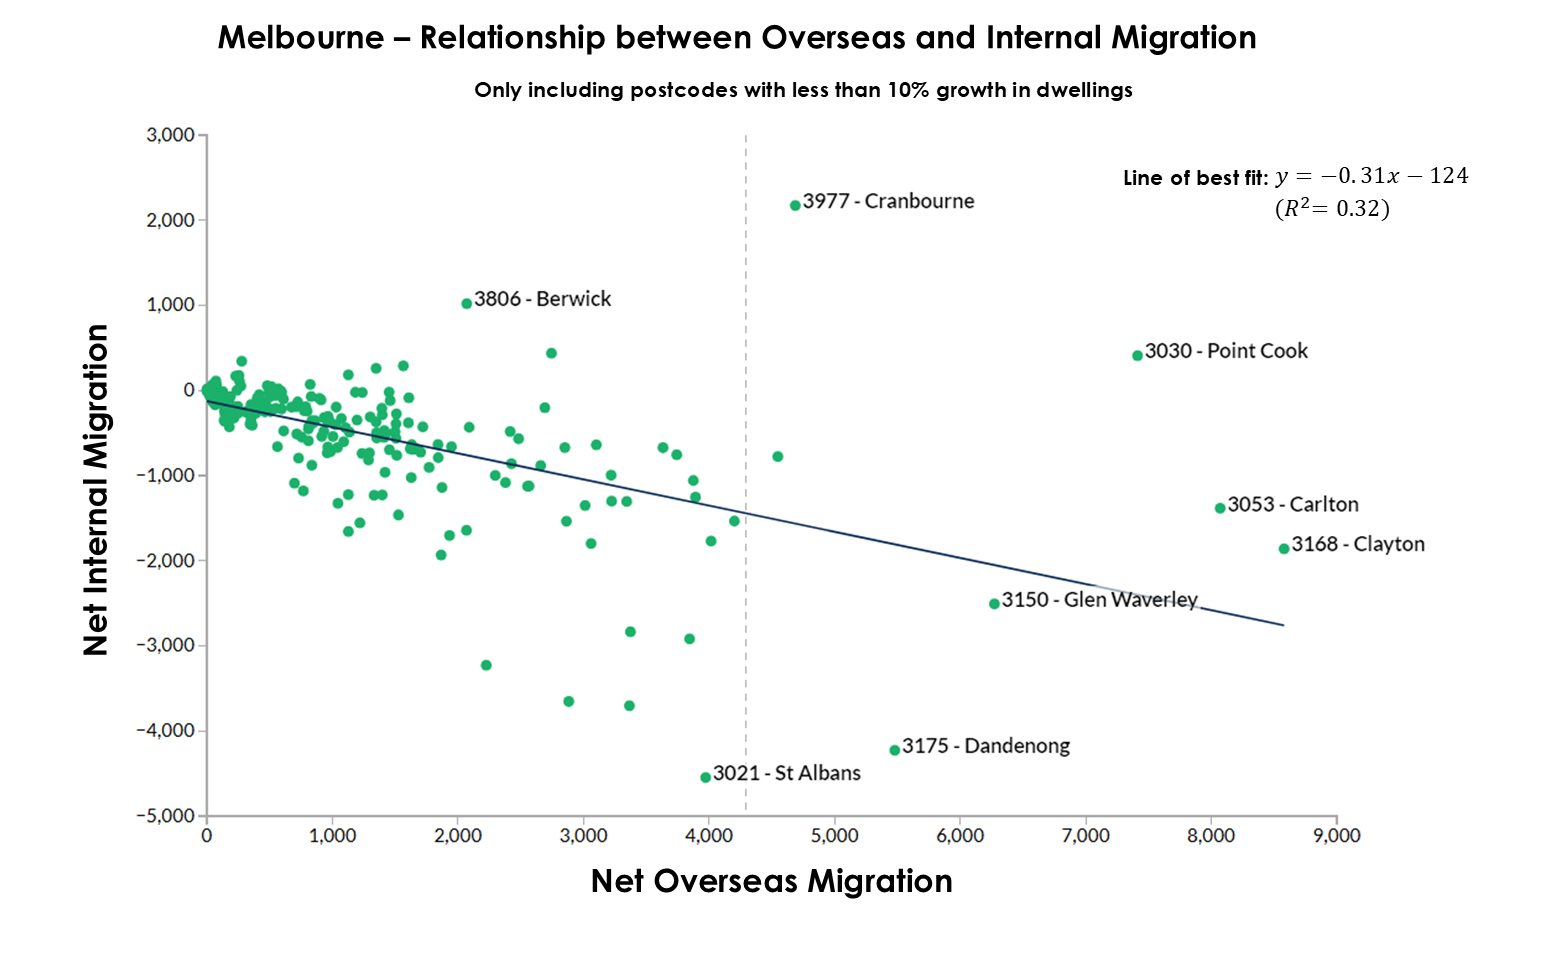
Growth patterns resembled Sydney’s, with inner-city areas driven by overseas migration near universities, while the north-west and south-east outskirts grew through internal migration combined with new housing developments. However, Melbourne’s suburbs showed a weaker negative correlation between overseas and internal migration compared to Sydney. Combined with Melbourne’s smaller net outflow due to internal migration, this could suggest the city’s periphery has been better suited to handle population growth compared to Sydney and its surrounding areas.
Although Melbourne added the most private dwellings of any capital city with 110,385 (6.1% growth), this was not enough to keep up with the city’s population growth. Melbourne had a ratio of 3.40 new residents for each occupied private dwellings.
Brisbane: Growth from All Sources
Brisbane’s population grew from 2,567,714 to 2,780,063 — an increase of 212,349 (8.3%). Unlike Sydney and Melbourne, Brisbane experienced positive growth from all sources: internal migration (56,087), overseas migration (113,680) and natural increase (42,582).
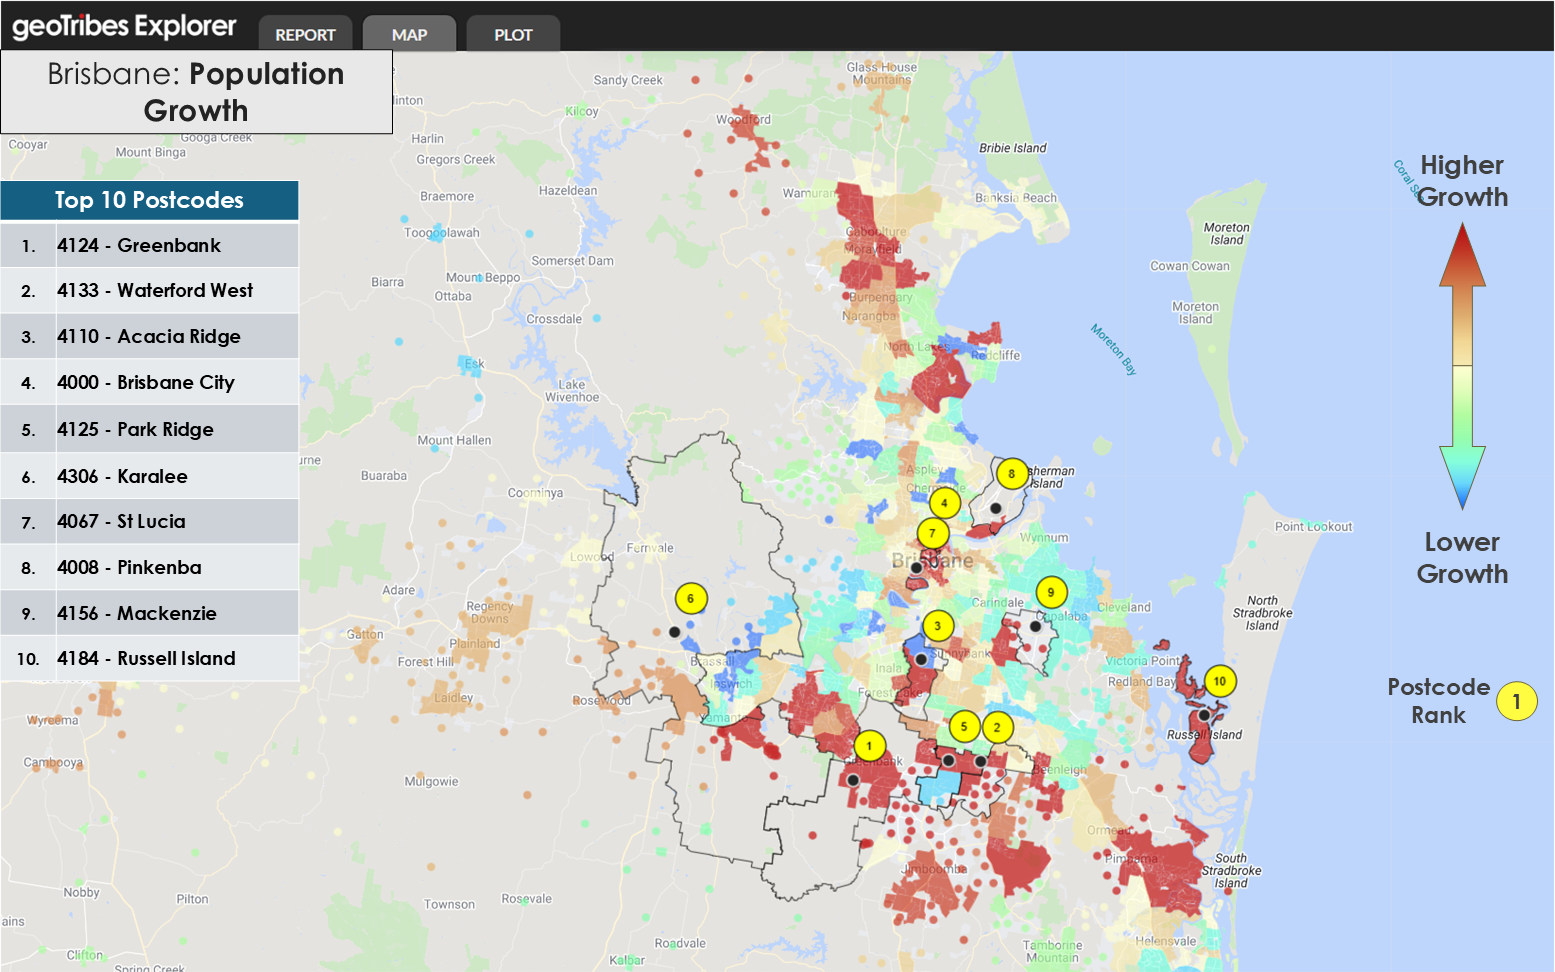 A heatmap of population growth, calculated as a percentage increase from 2021 ERP. The ten postcodes with the greatest percentage increase in population are highlighted.
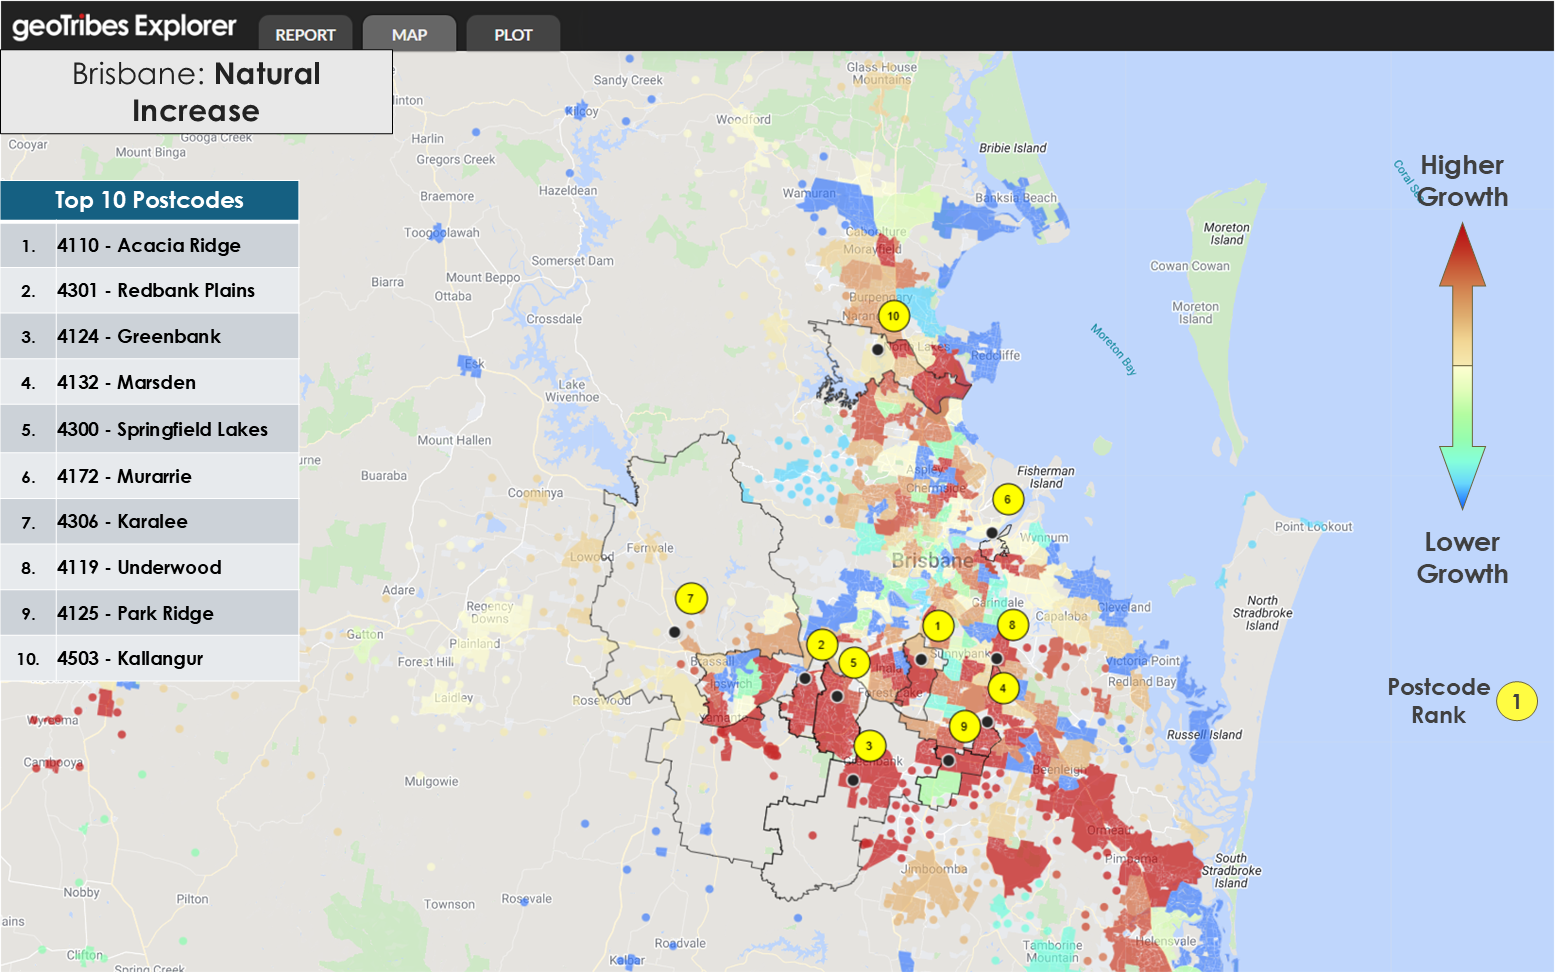
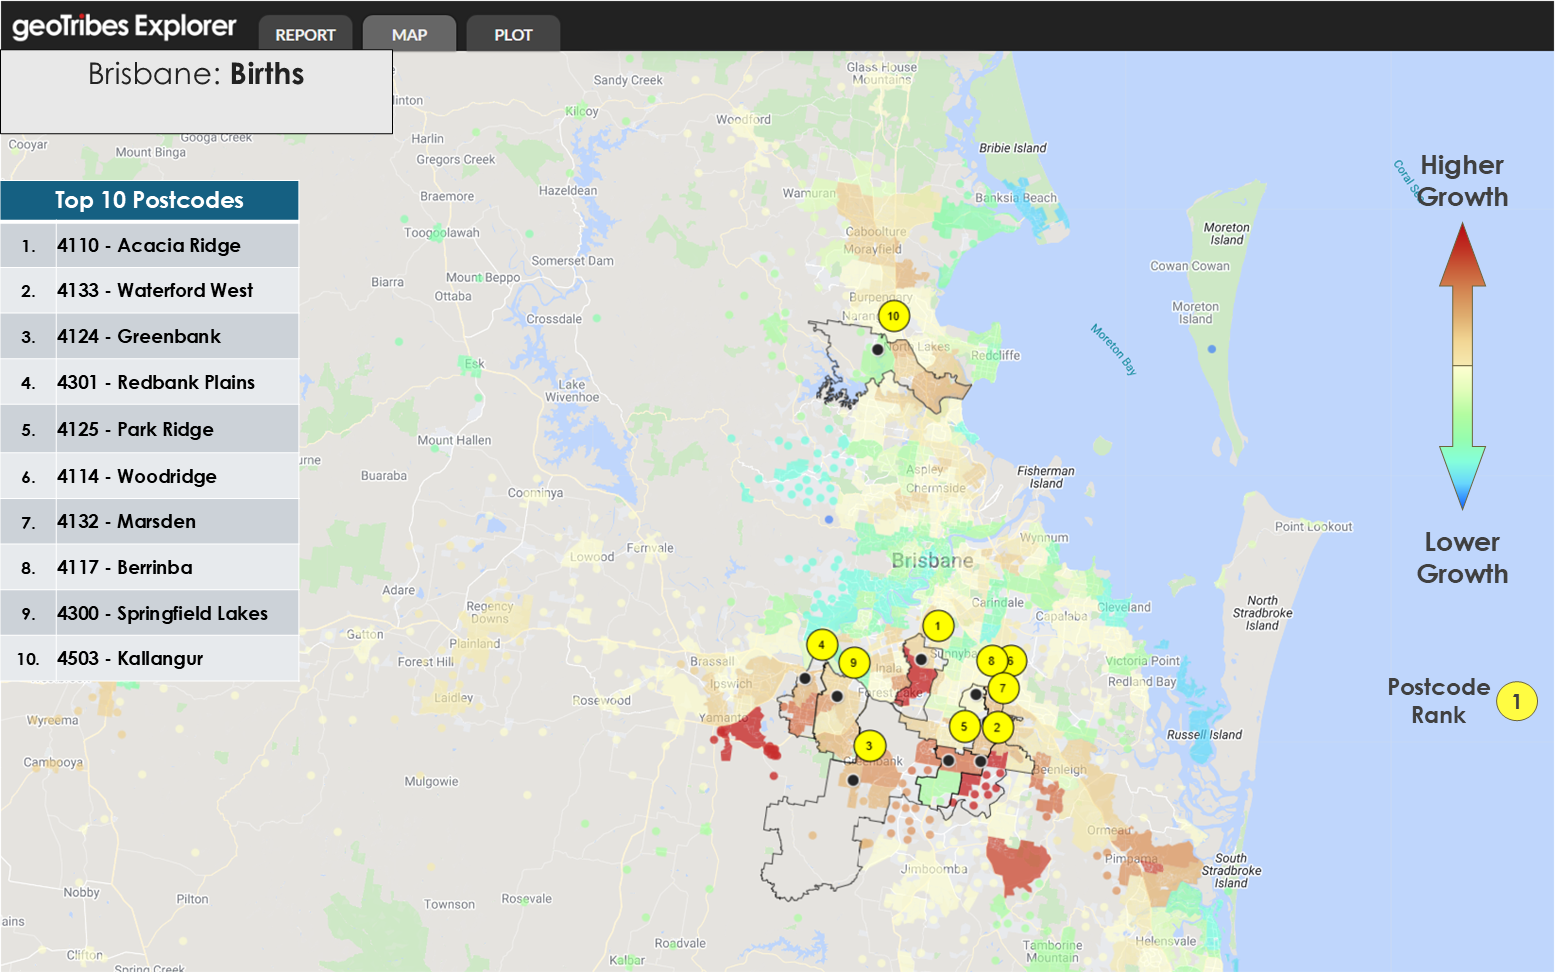
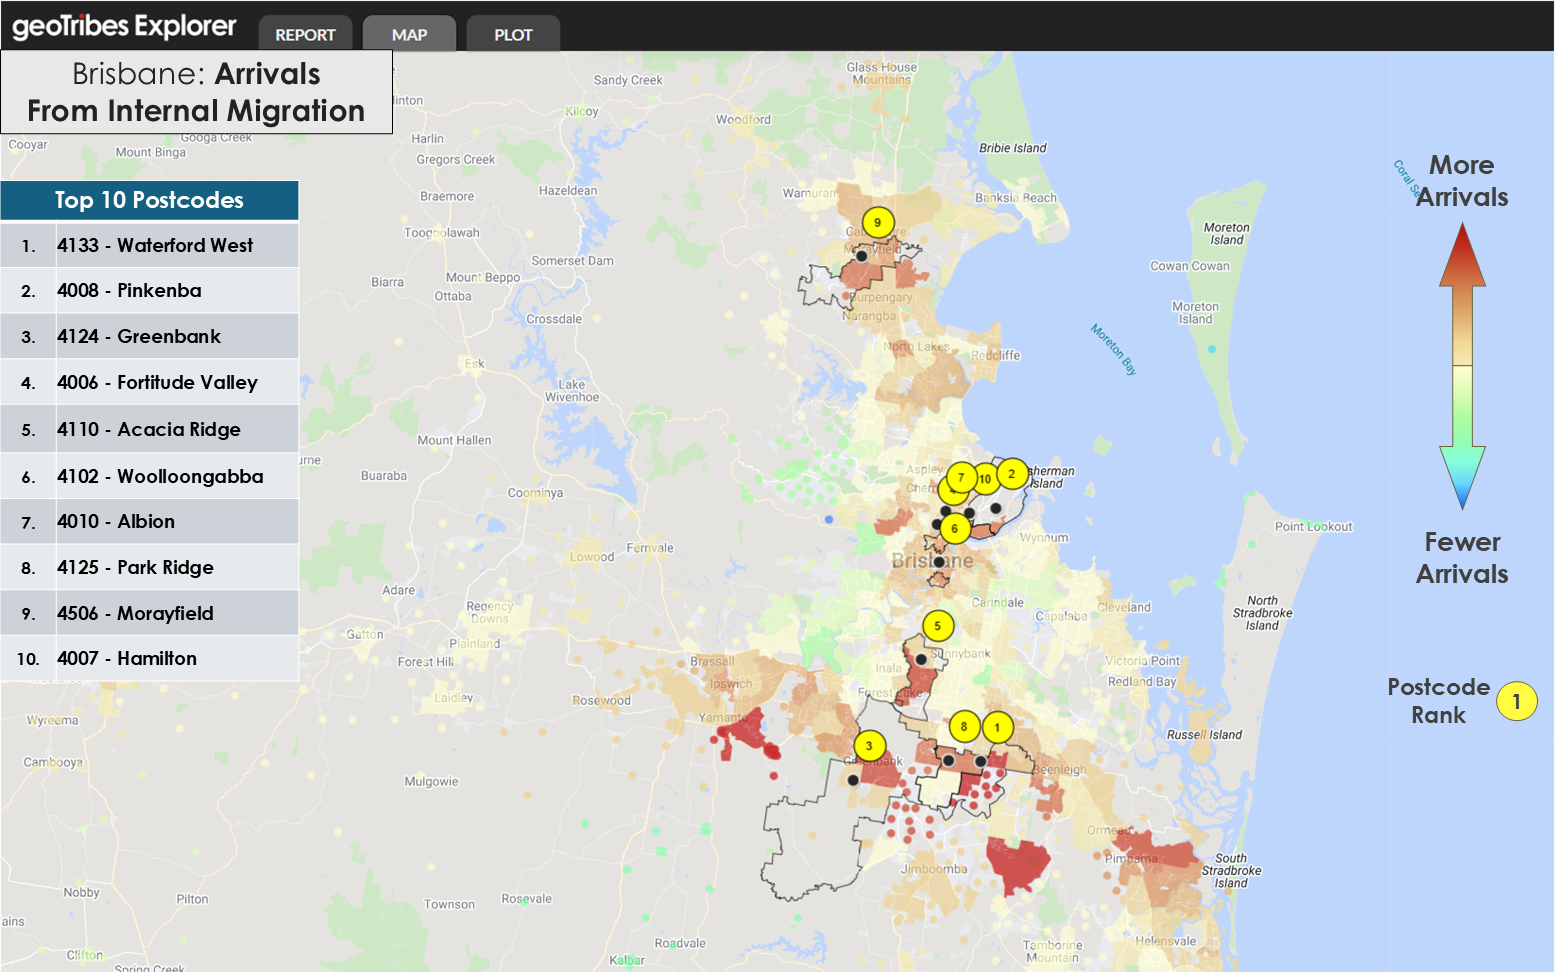
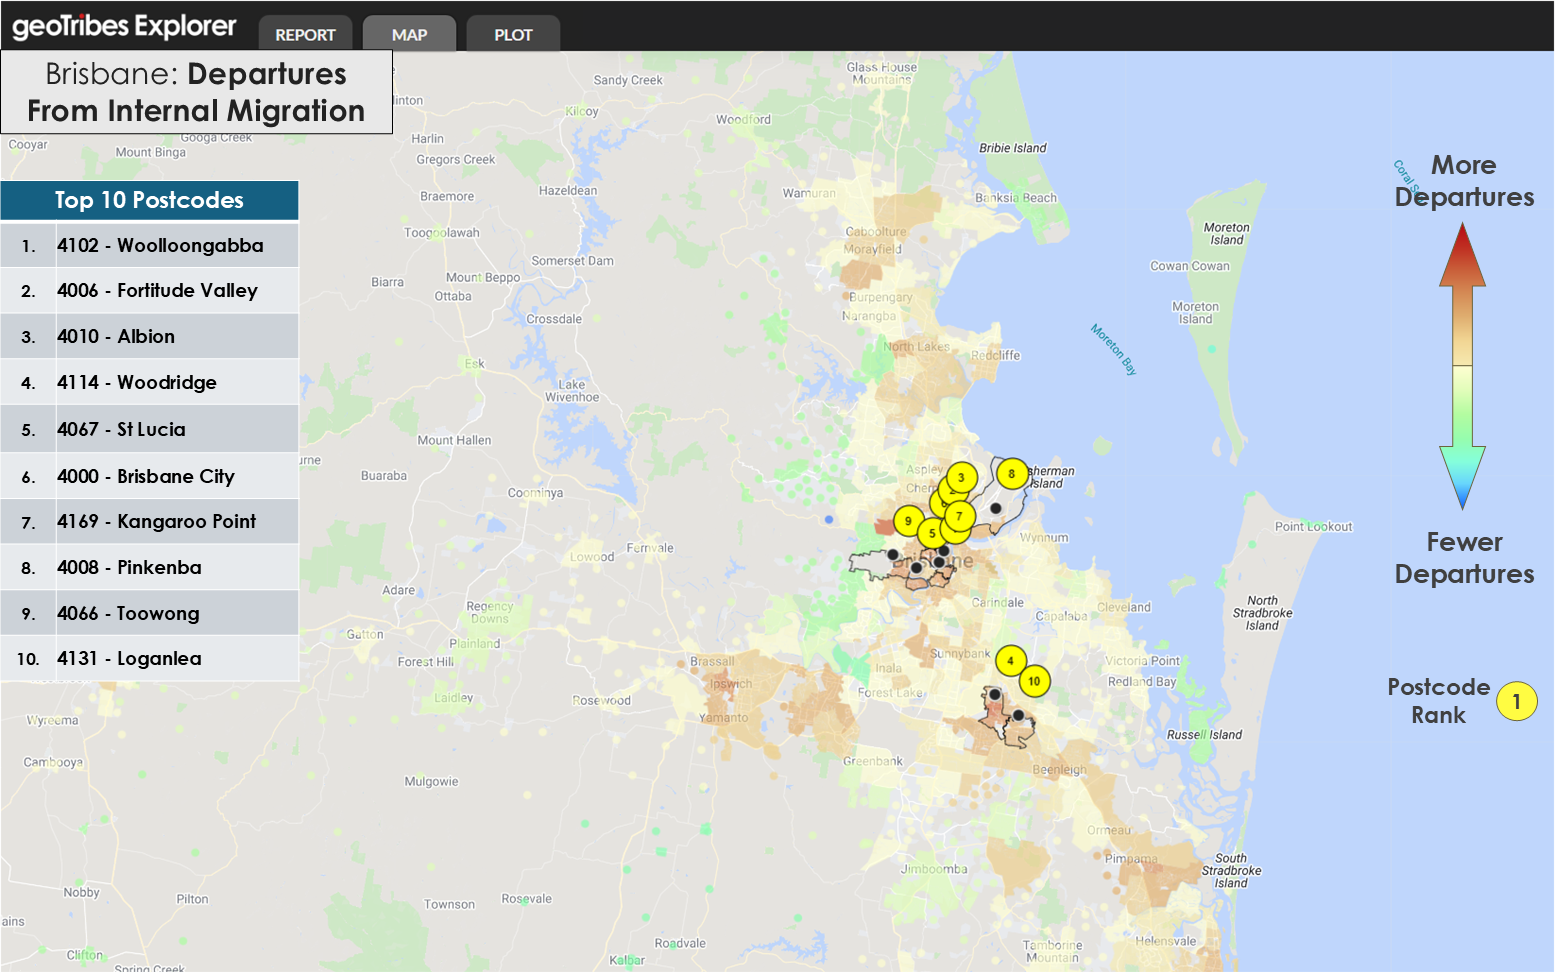
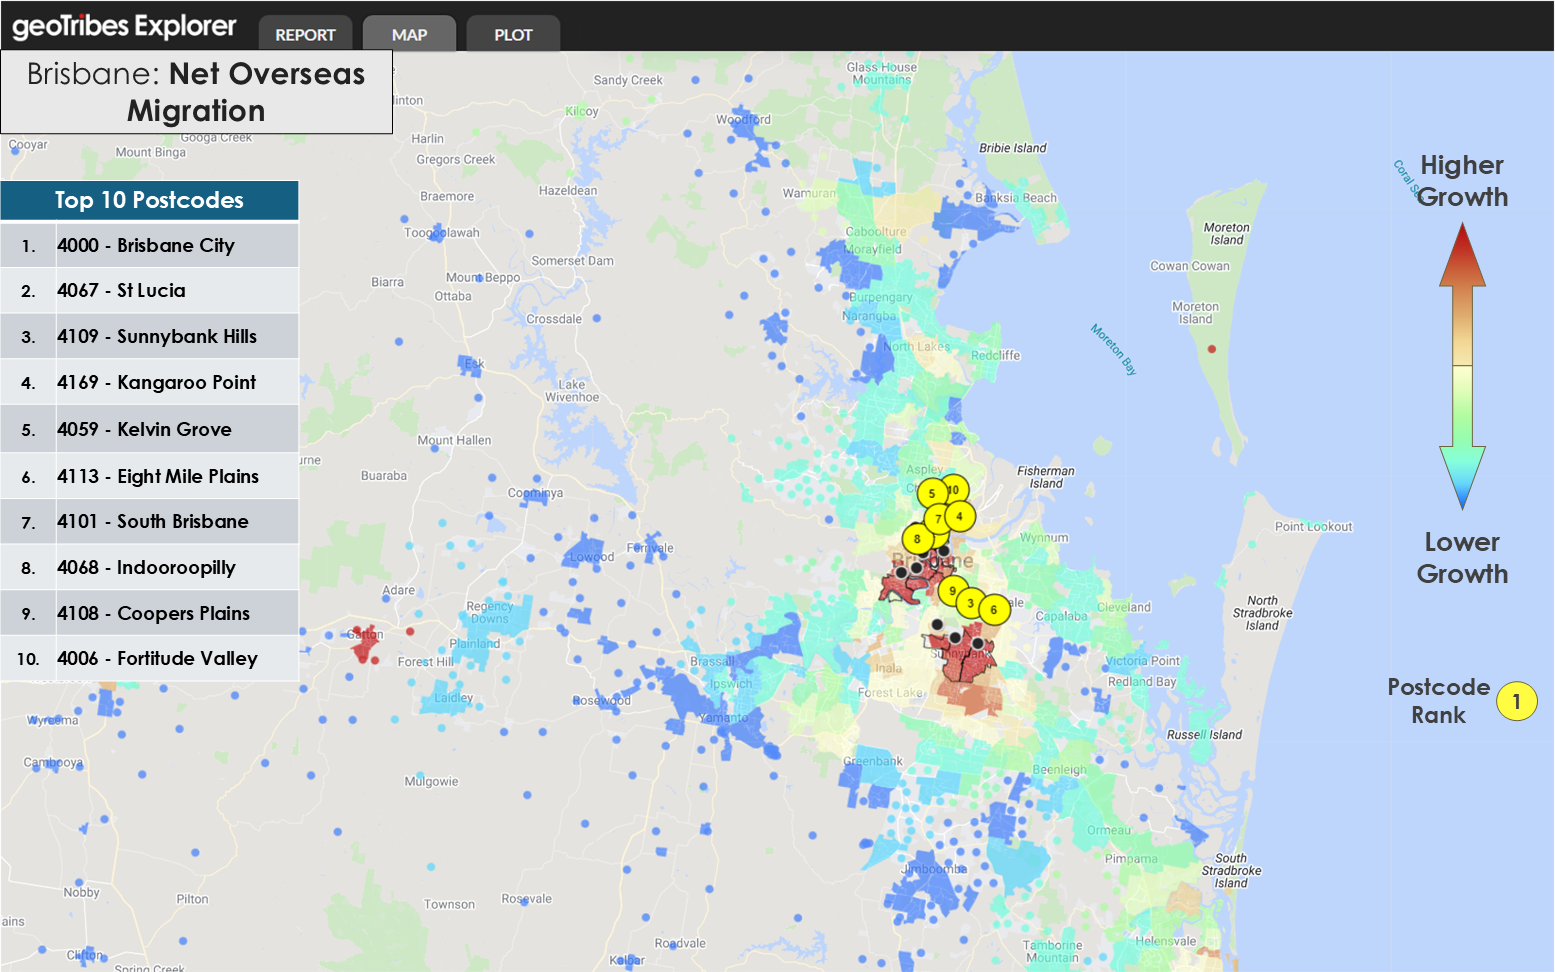
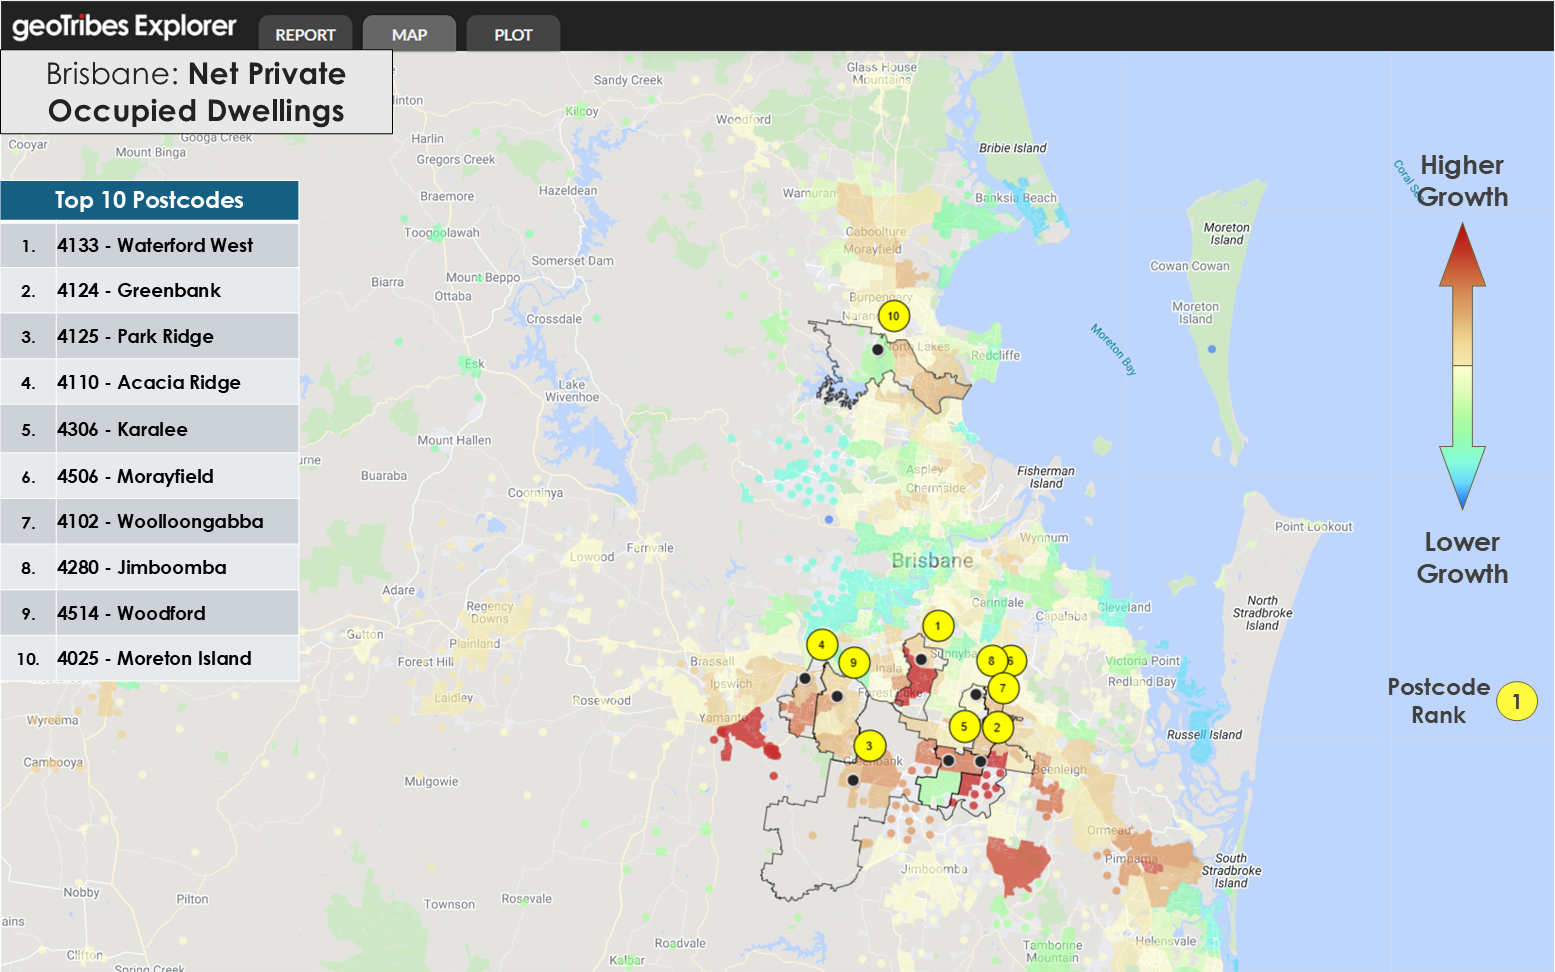
Growth near the Brisbane CBD and the Gold Coast was driven by overseas migration, while internal migration moved established residents from the city centre towards new housing developments in both northern (Moreton Bay) and southern (Logan City) areas. Birth rates were higher in the south, indicating young families comprised a significant portion of internal migrants to these locations.
Brisbane gained 54,444 new private dwellings (5.9% growth), resulting in a ratio of 3.9 new residents per new private dwelling.
Adelaide: Balanced Growth Patterns
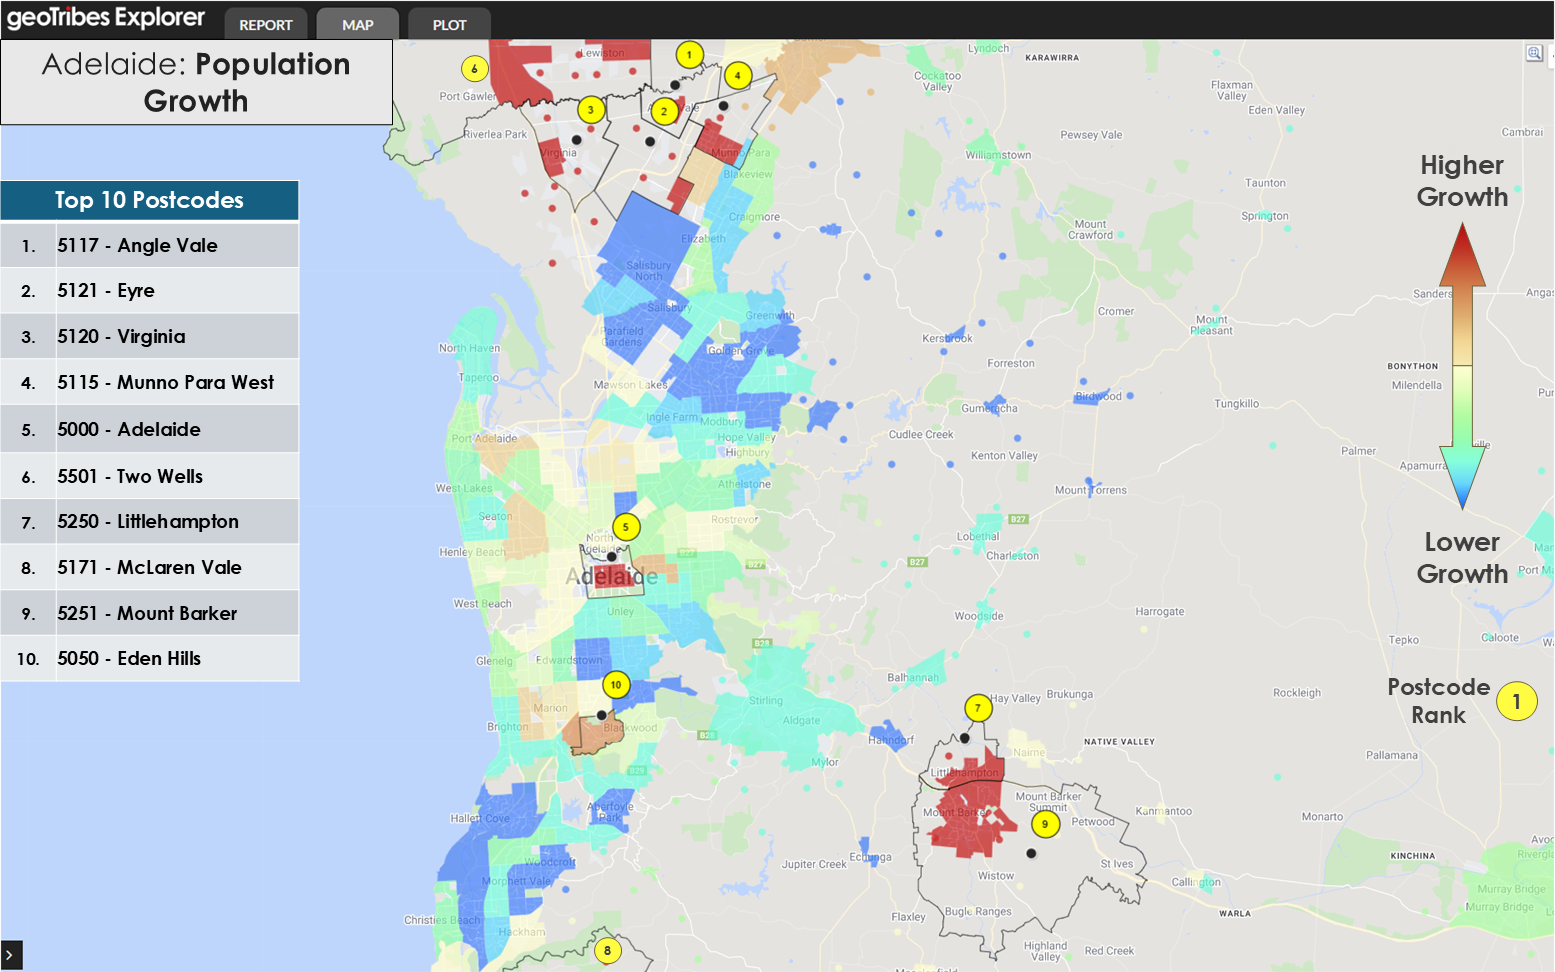
Adelaide’s population grew from 1.40 million to 1.47 million, an increase of 67,291 (4.8%). Overseas migration contributed 61,916 people, natural increase added 11,238, while internal migration showed a net loss of 5,863 people.
 A heatmap of population growth, calculated as a percentage increase from 2021 ERP. The ten postcodes with the greatest percentage increase in population are highlighted.
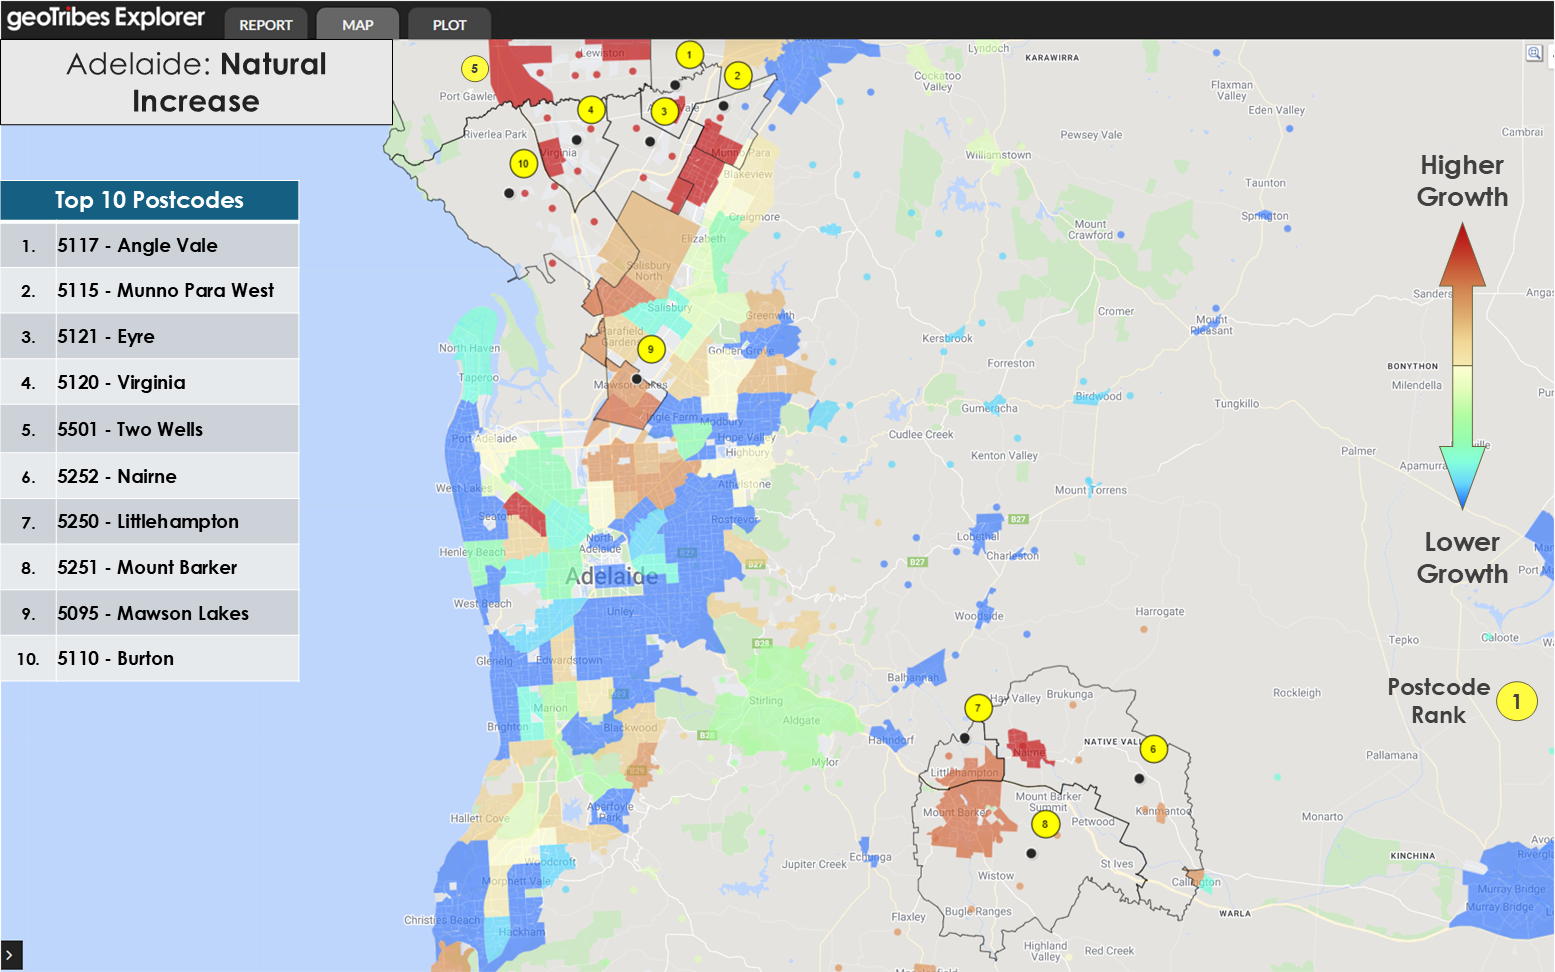
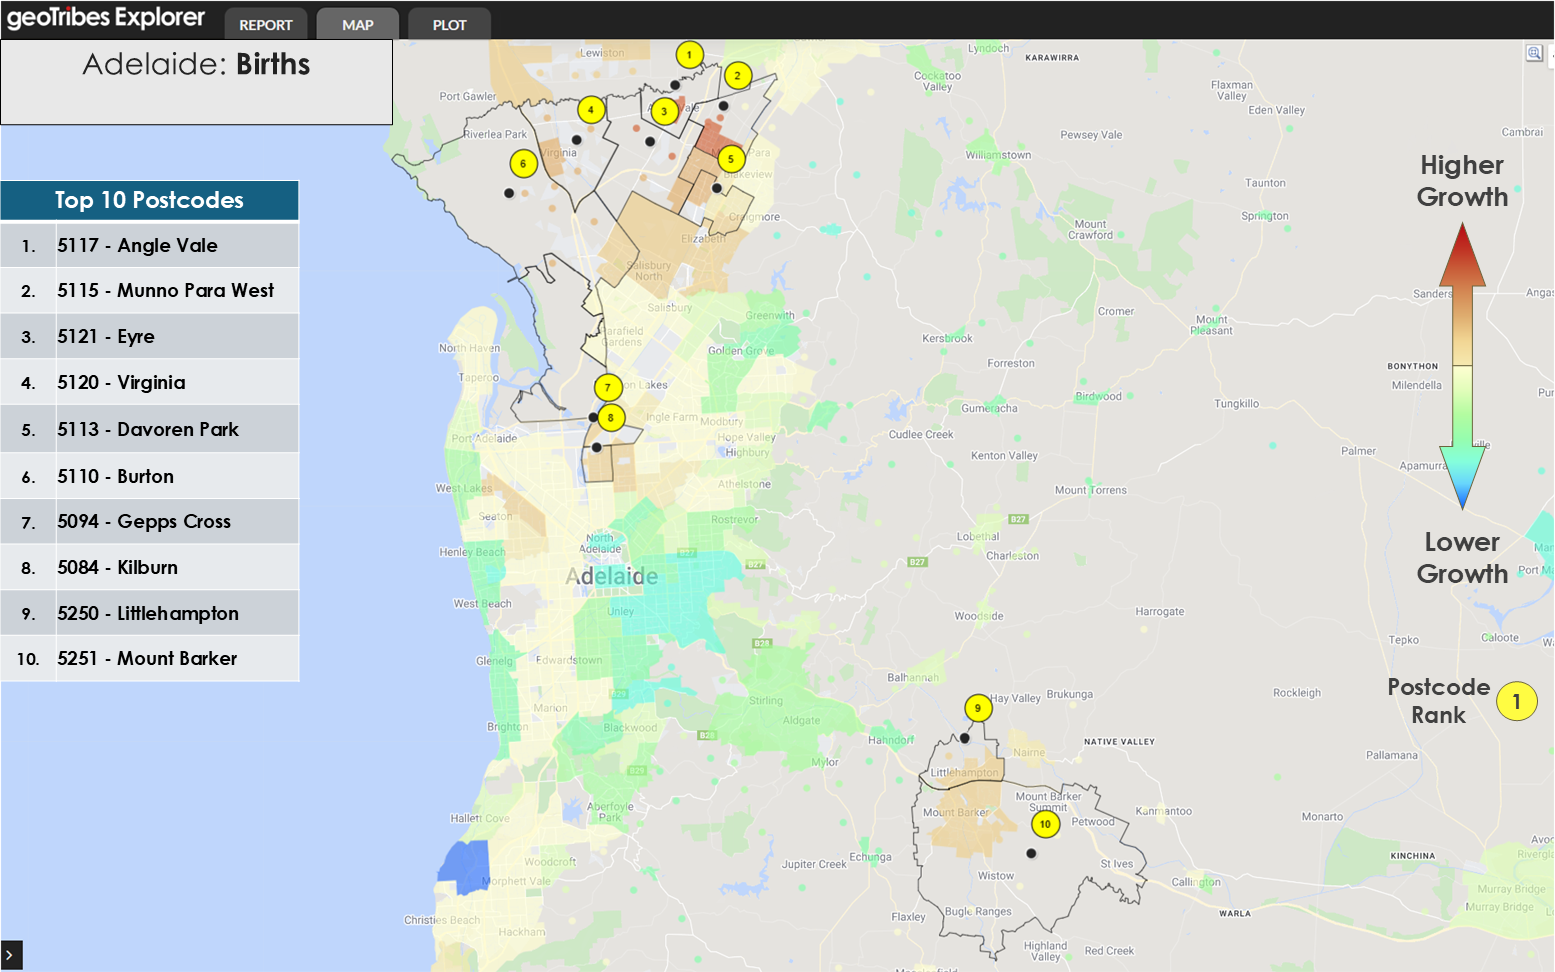
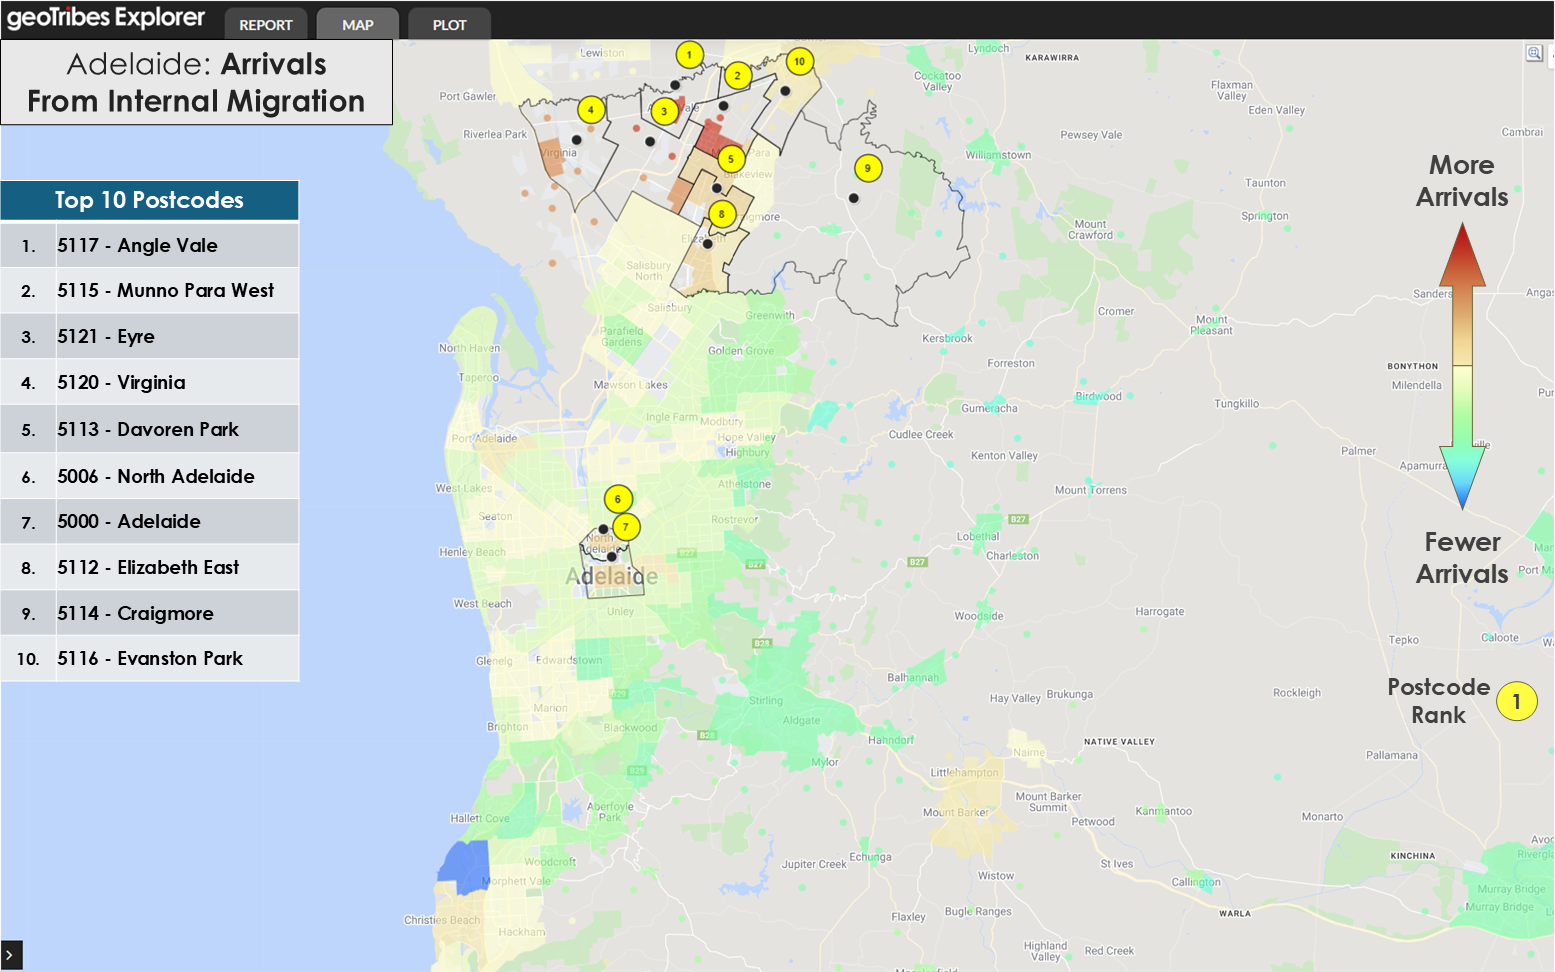
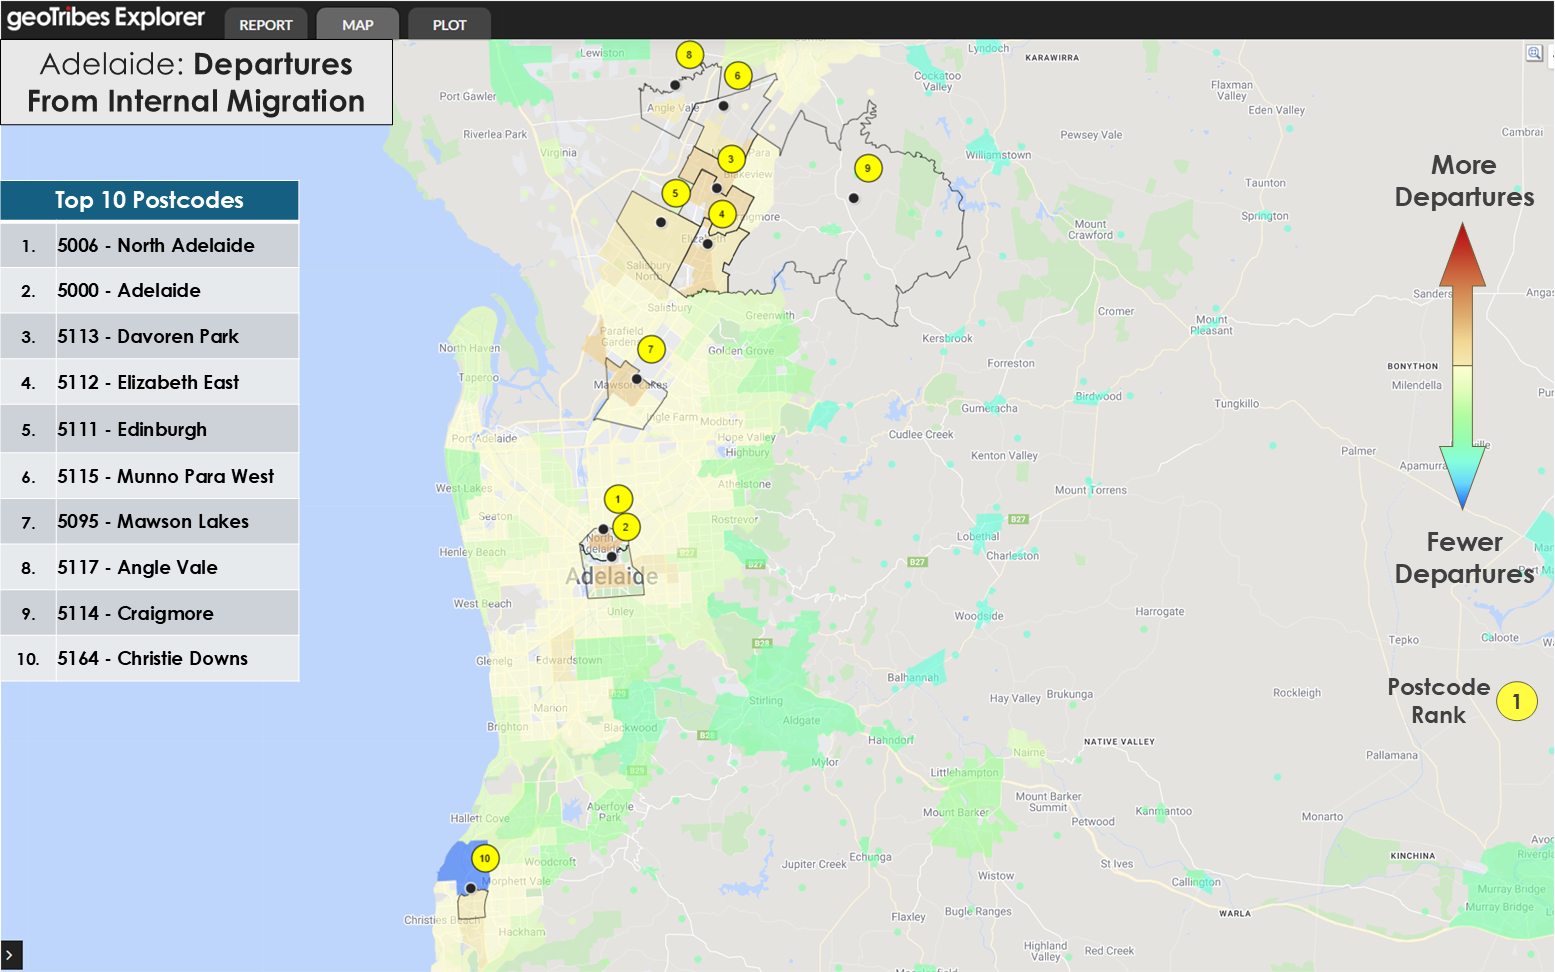
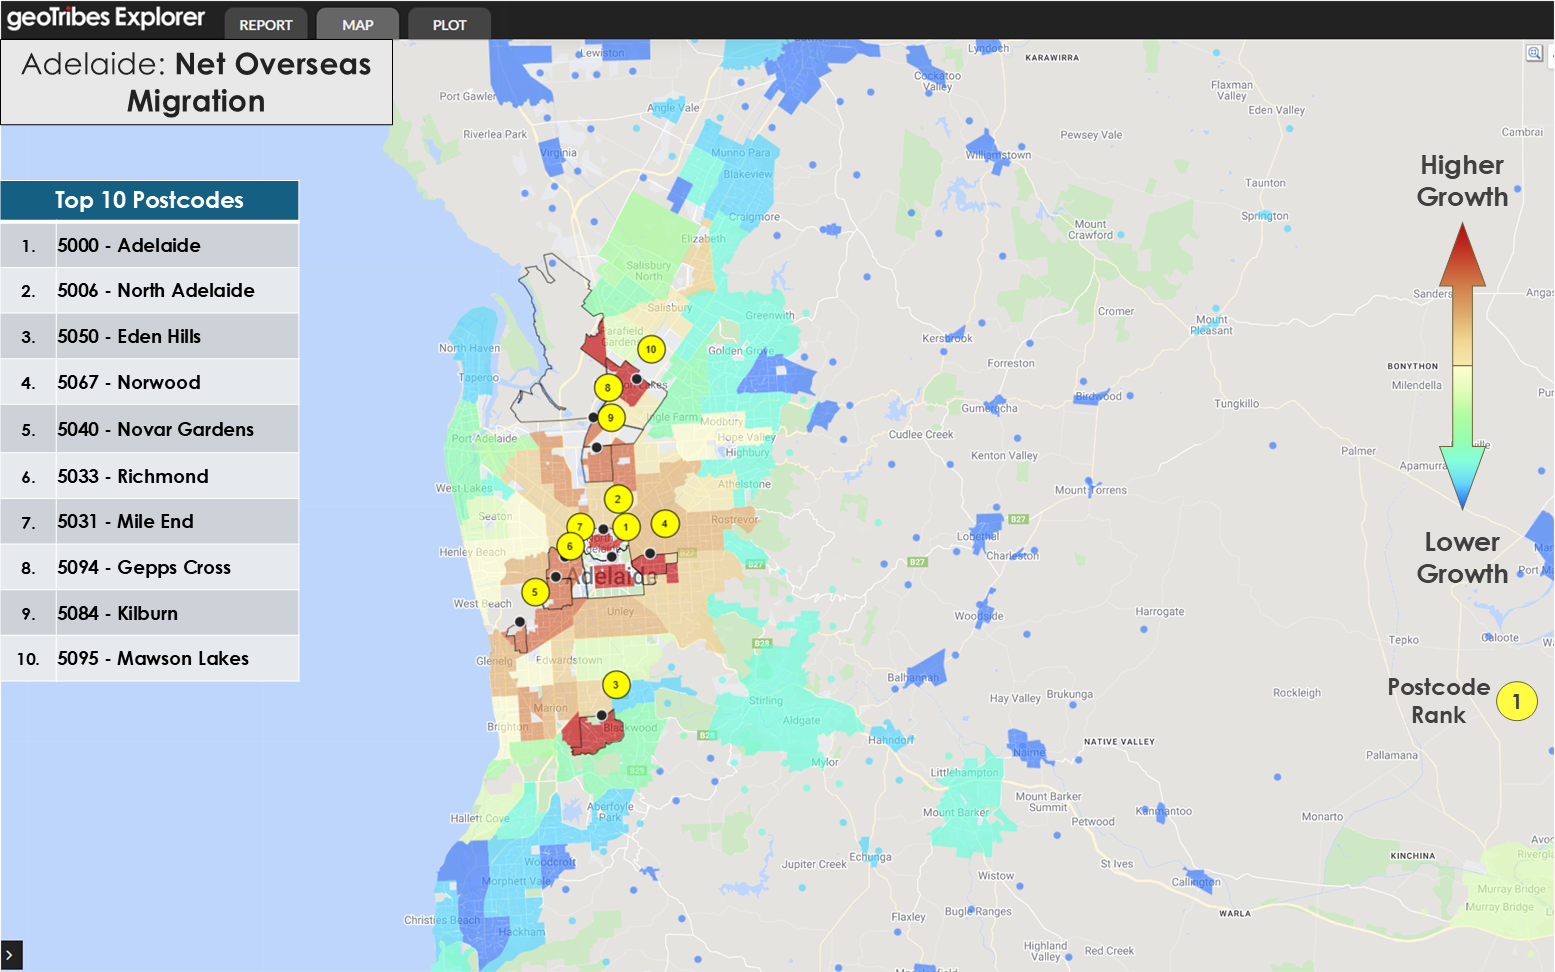
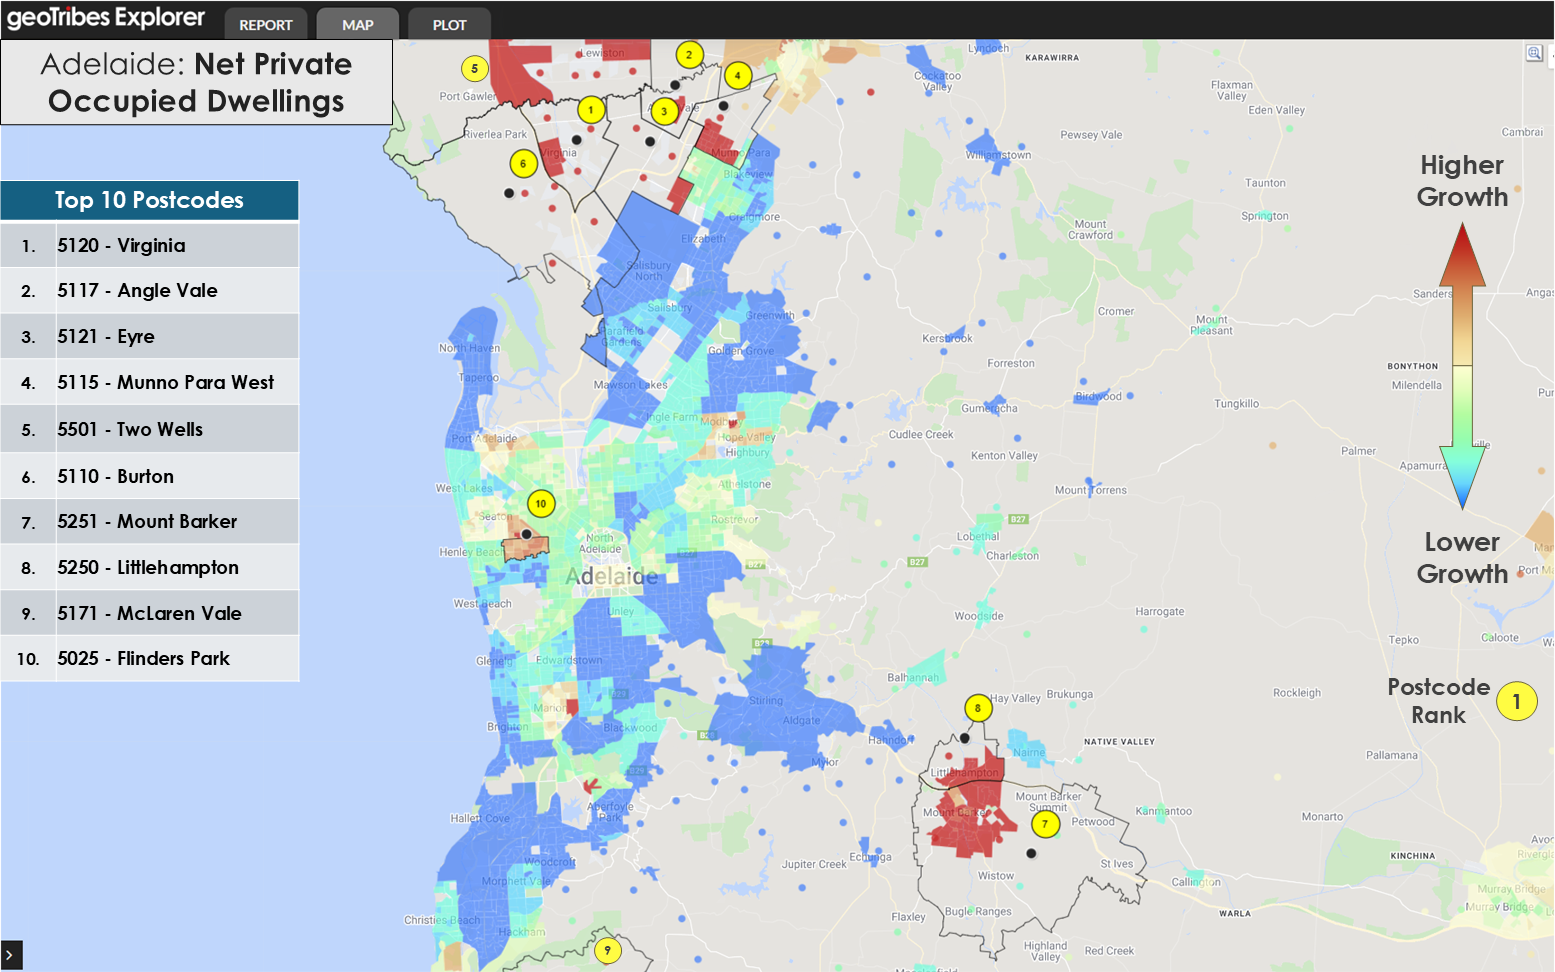
Following a similar pattern to other capital cities, growth was concentrated in the outskirts of the greater city area (due to internal migration and natural increase) and the inner city (due to overseas migration). The city added 19,566 new private dwellings (3.6% growth), resulting in 3.4 new residents per new occupied private dwelling.
Perth: Highest Growth Rate Among All Capital Cities
Perth experienced the highest growth rate among capital cities, adding 192,533 residents (8.8% growth) to reach 2.38 million people. Growth came from all sources: overseas migration (128,367), internal migration (27,542), and natural increase (36,624). Along with Brisbane, Perth was notable for its net positive internal migration, indicating the city attracted established Australians from other regions.
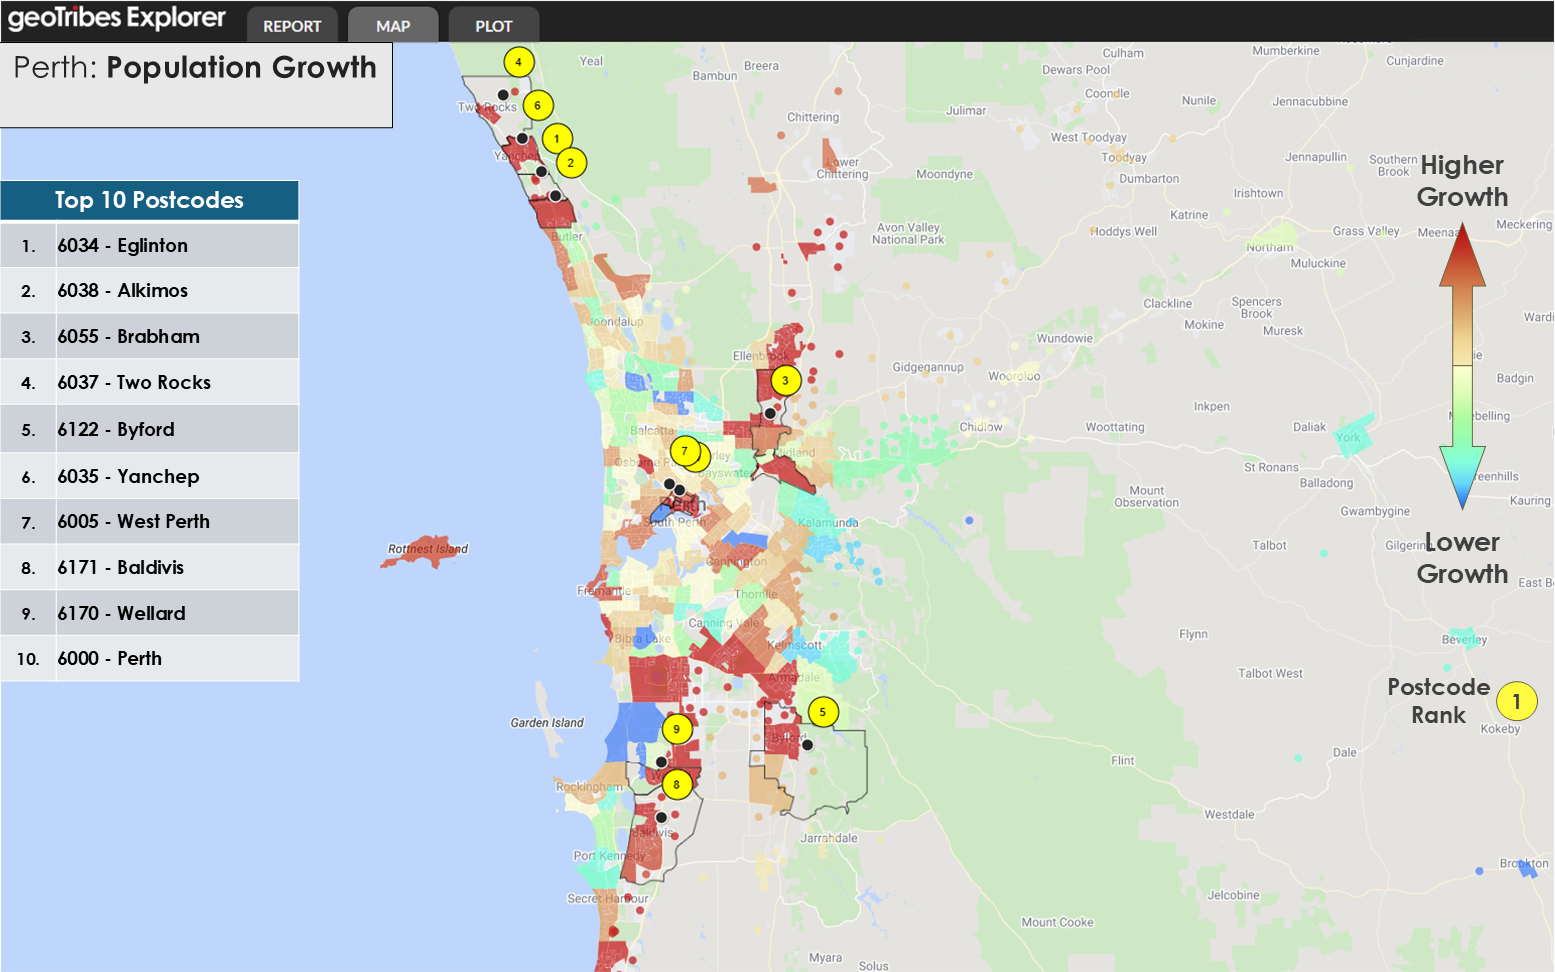 A heatmap of population growth, calculated as a percentage increase from 2021 ERP. The ten postcodes with the greatest percentage increase in population are highlighted.
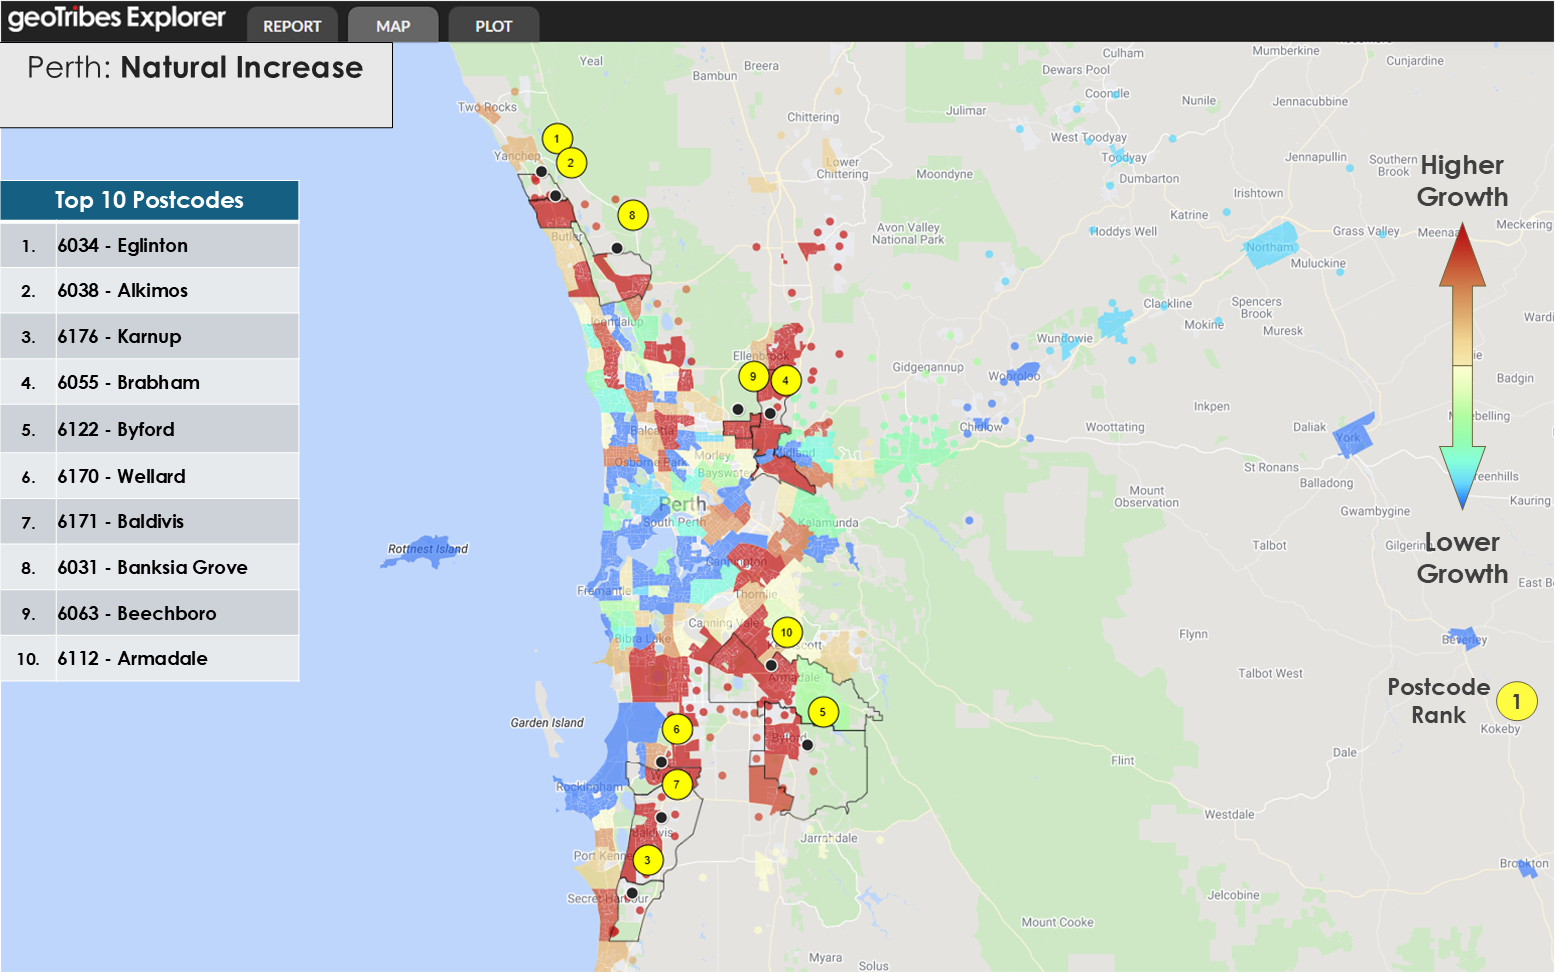
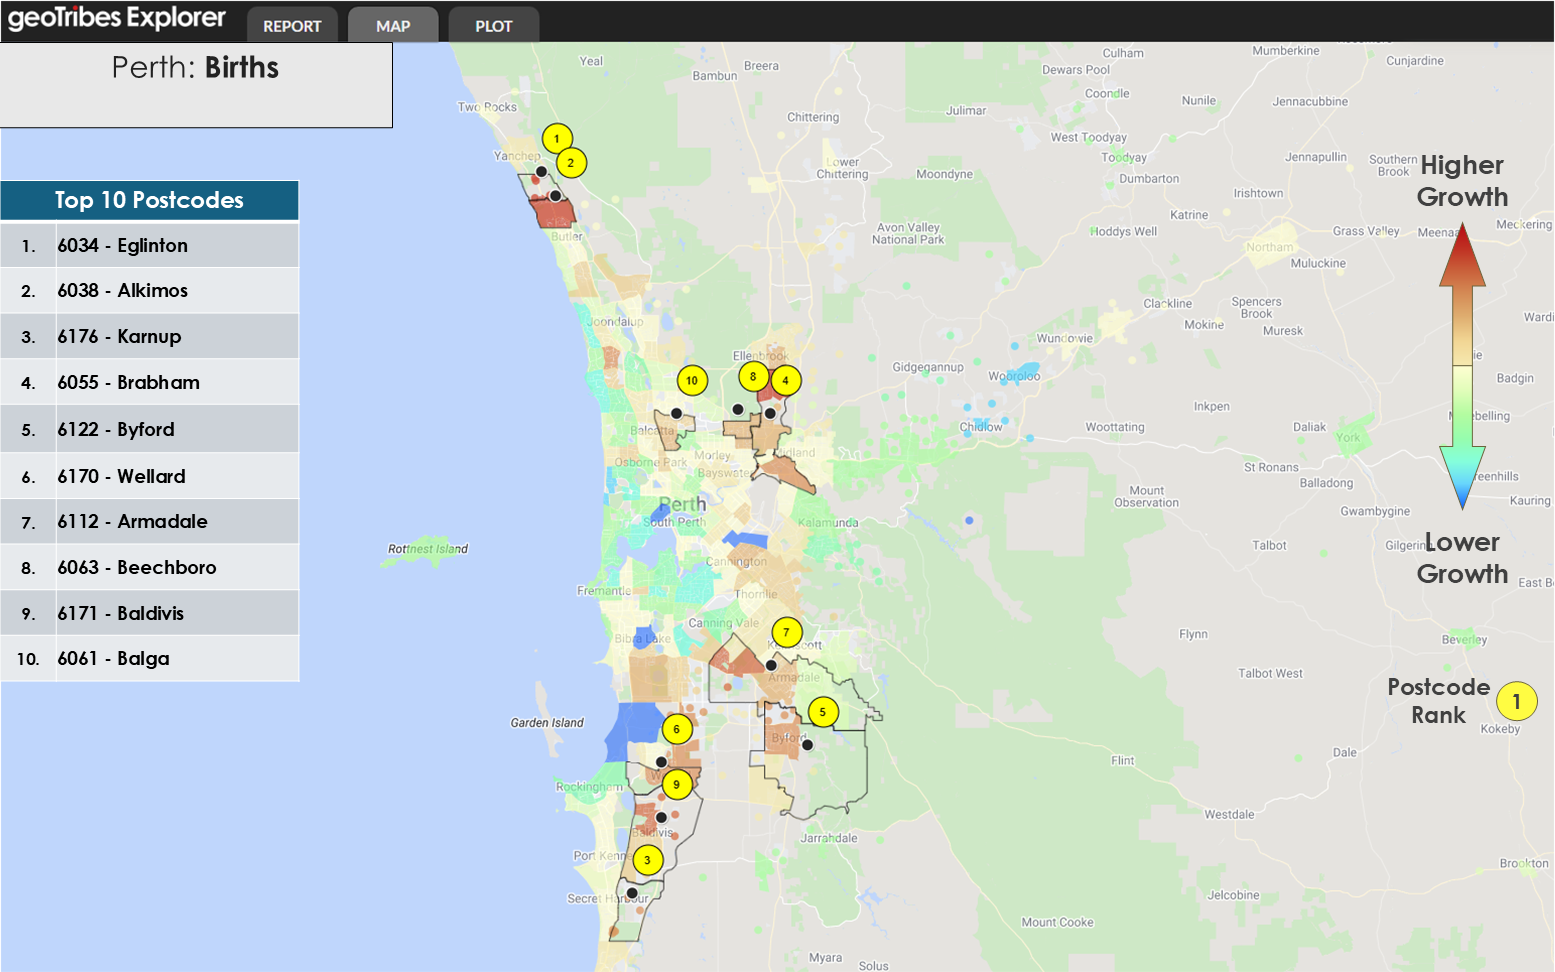
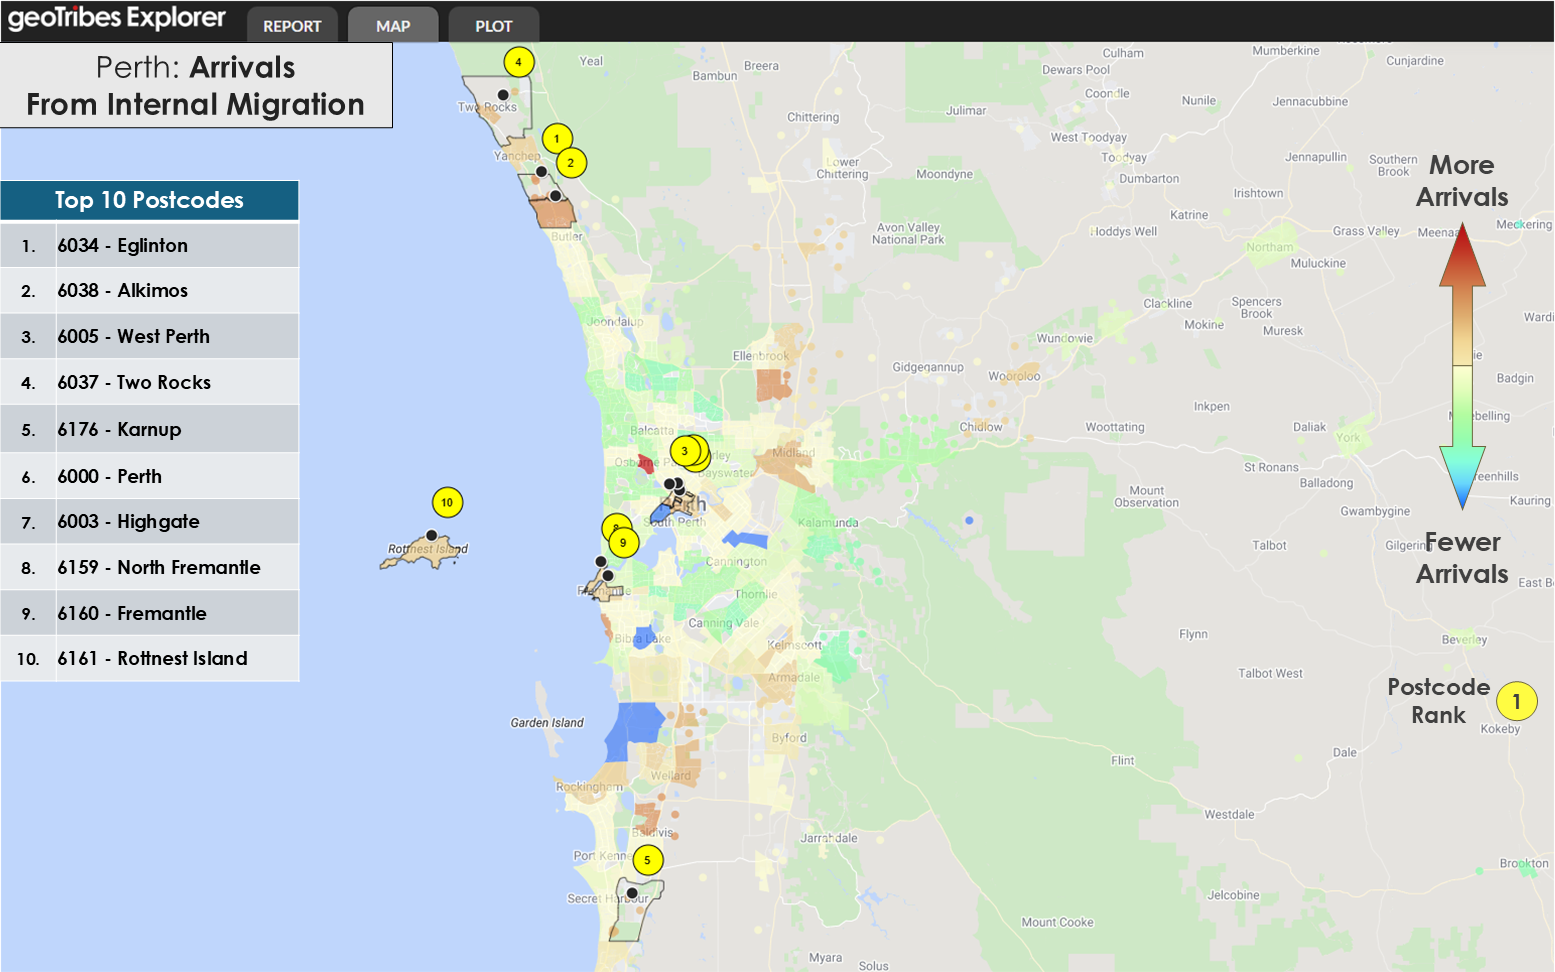
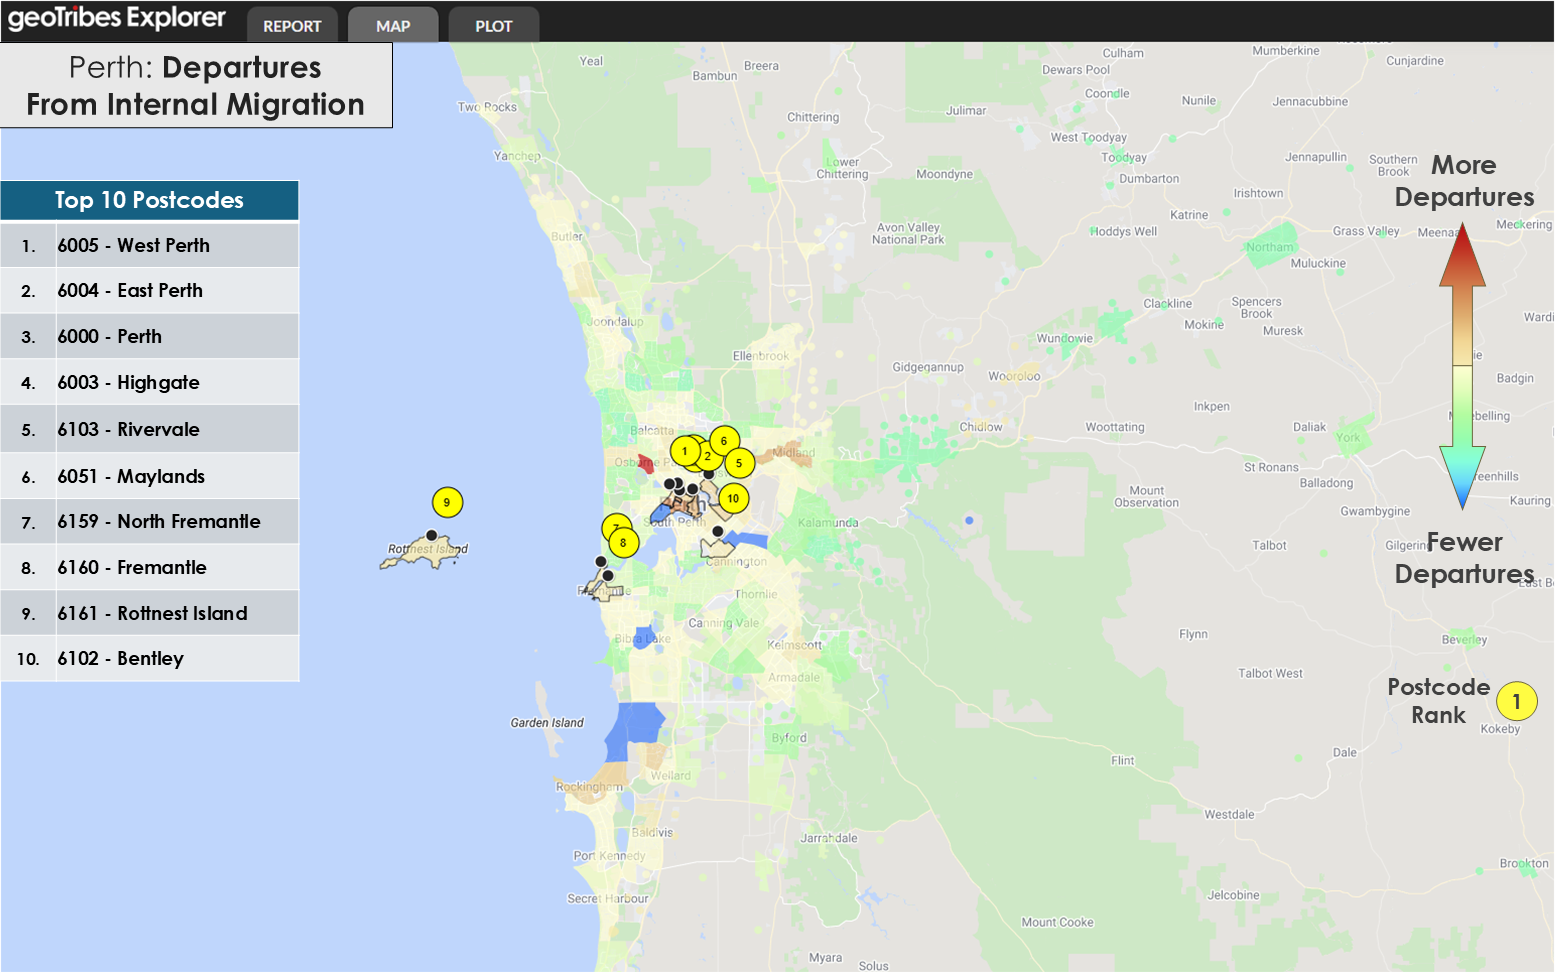
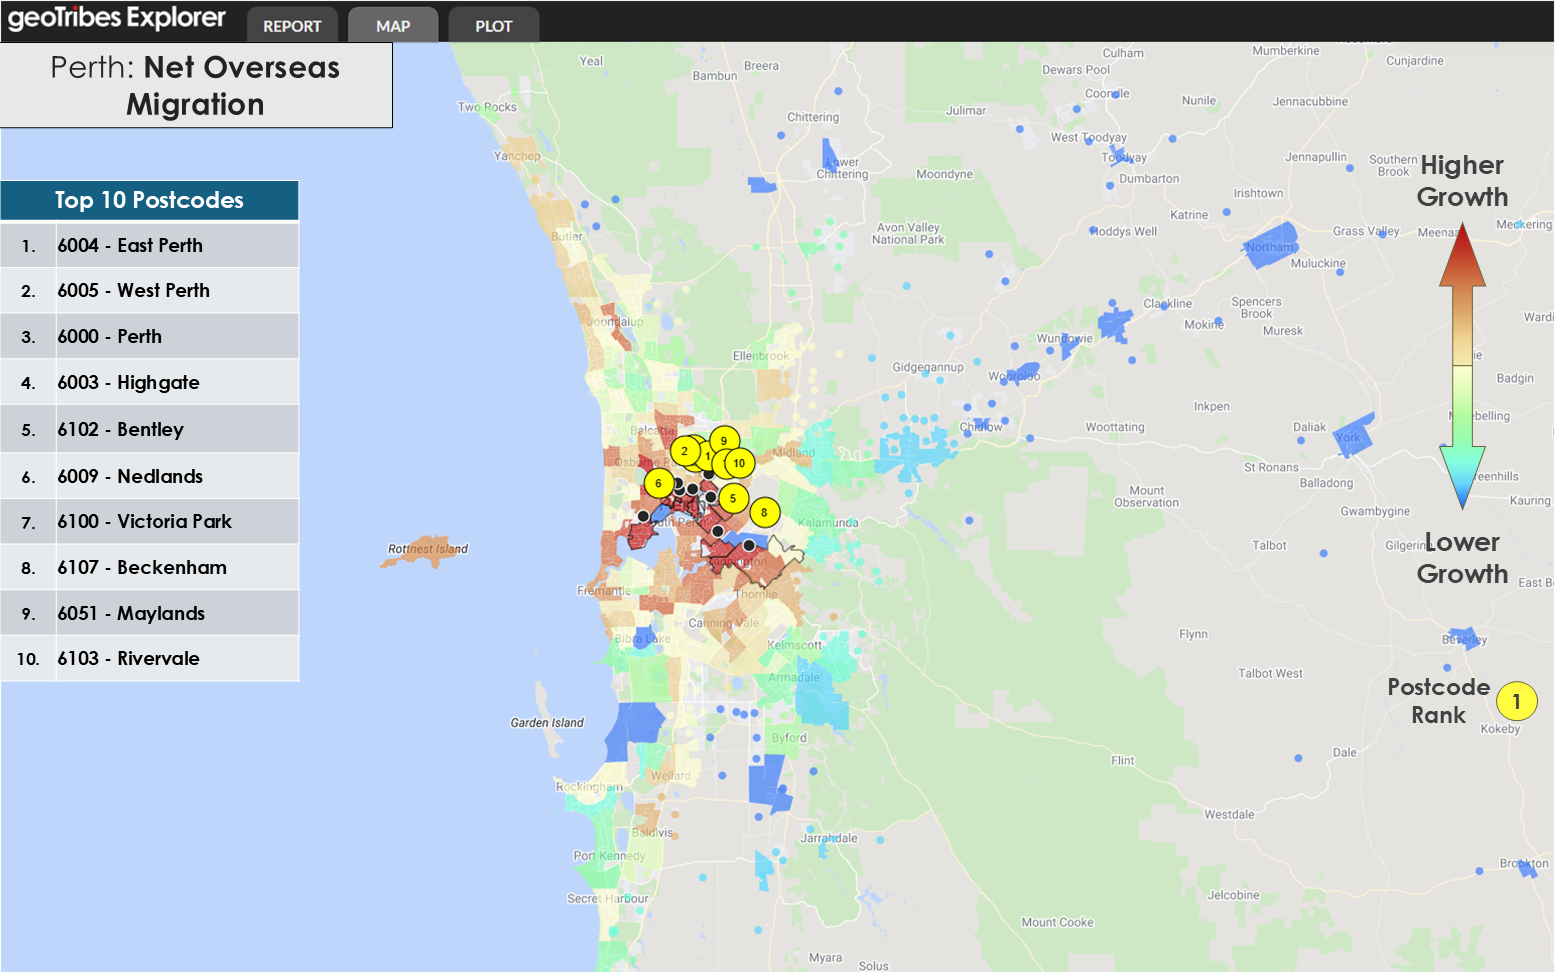
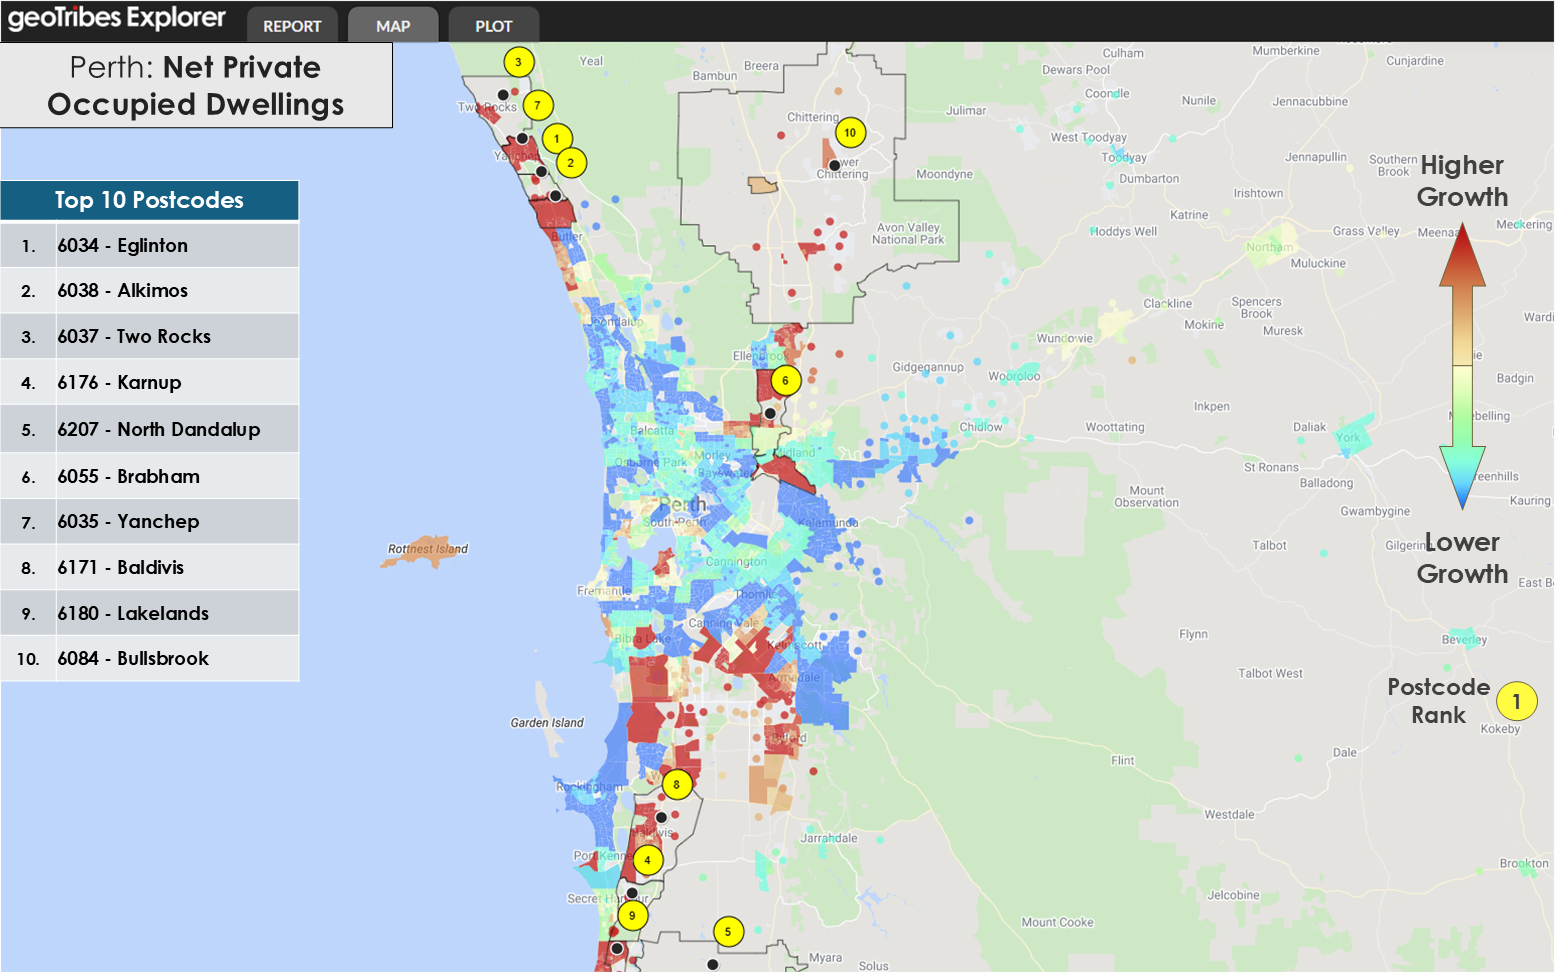
Despite its higher overall growth rate, Perth followed a similar pattern to other cities, with overseas migration concentrated in the centre and internal migration towards the outskirts. Perth added 32,656 new private dwellings (4.1% growth), resulting in 5.9 new residents per new private dwelling, the highest ratio among all capitals.
Hobart: Modest Growth
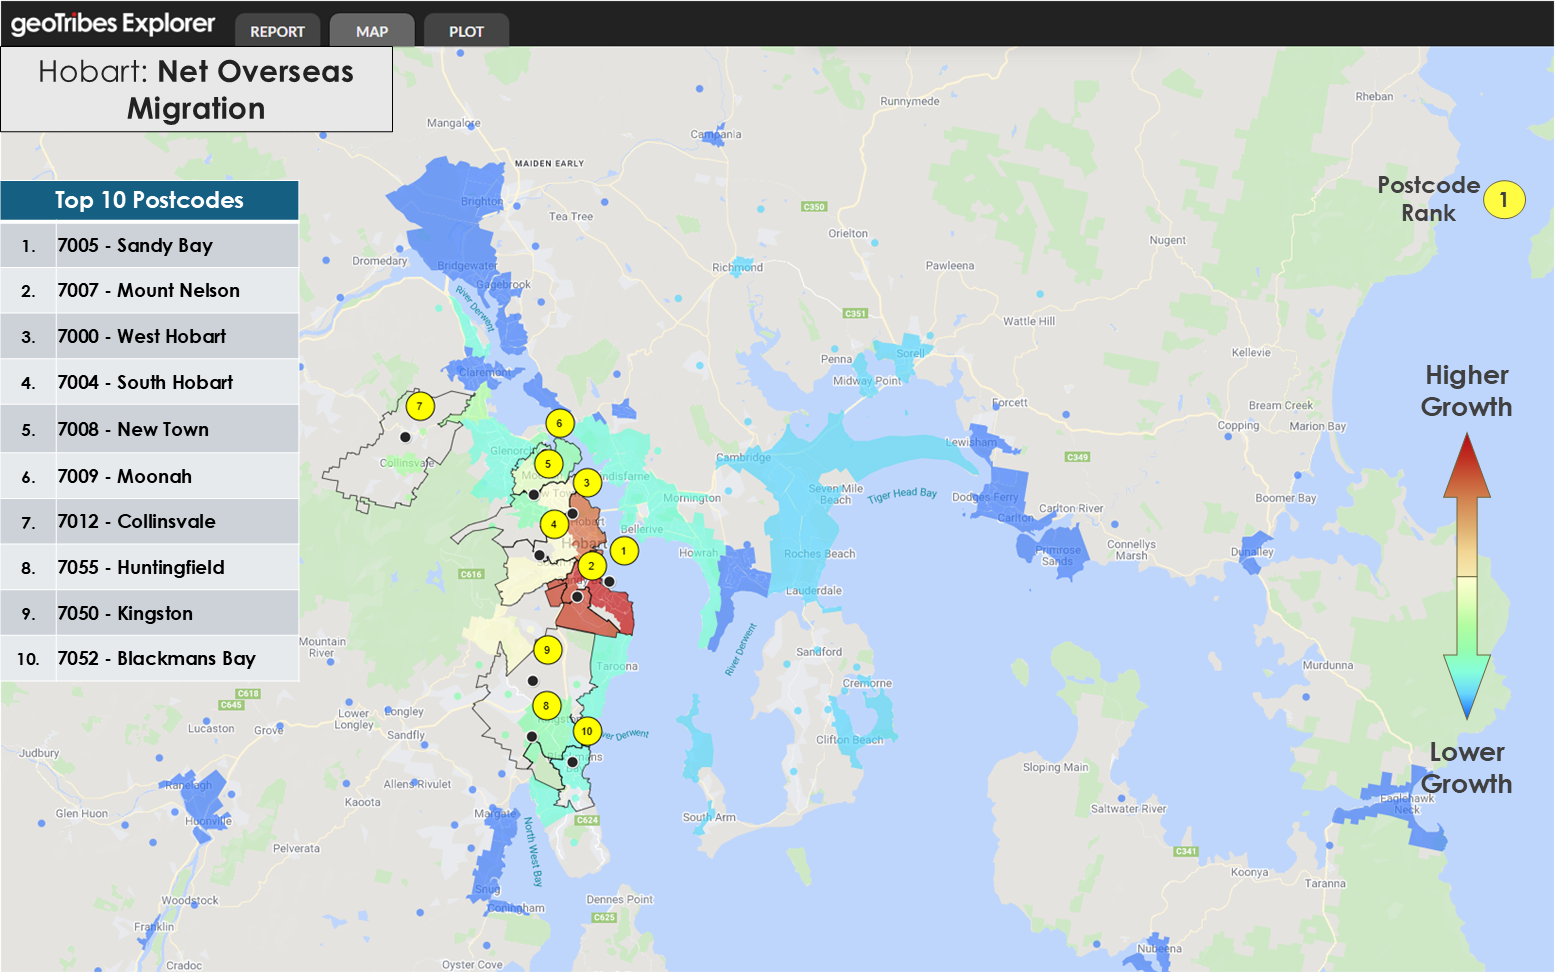
Hobart recorded the slowest growth among capital cities, increasing by 4,213 people (1.7%) to reach 254,930 residents. Growth came from overseas migration (7,406) and natural increase (1,667), offset by internal migration losses of 4,860 people.
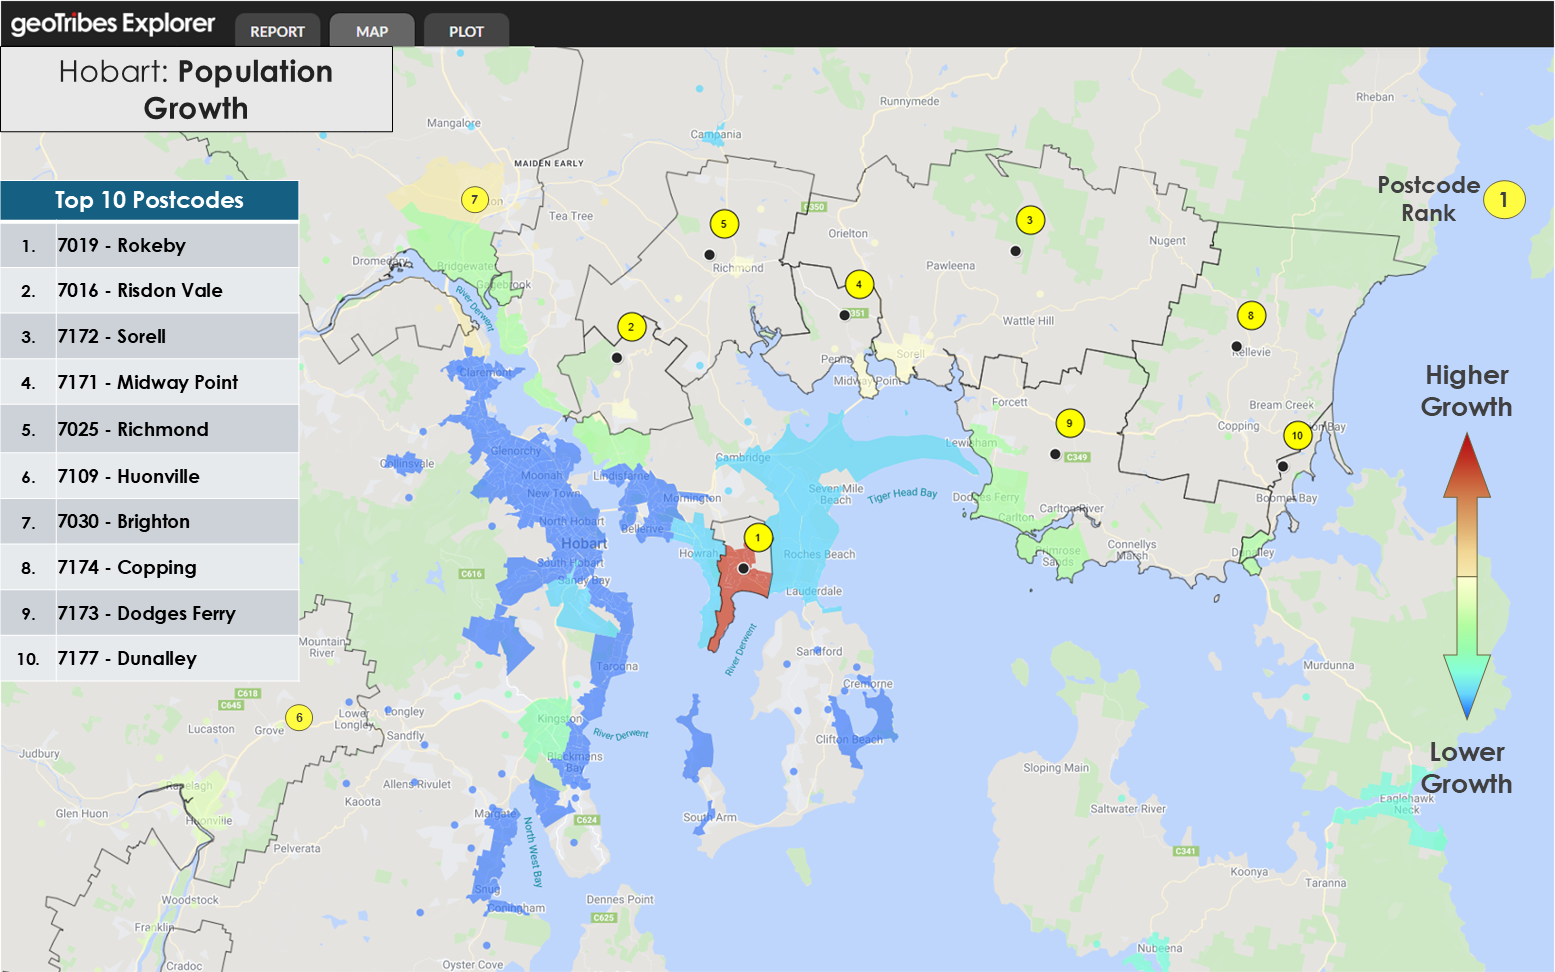 A heatmap of population growth, calculated as a percentage increase from 2021 ERP. The ten postcodes with the greatest percentage increase in population are highlighted.
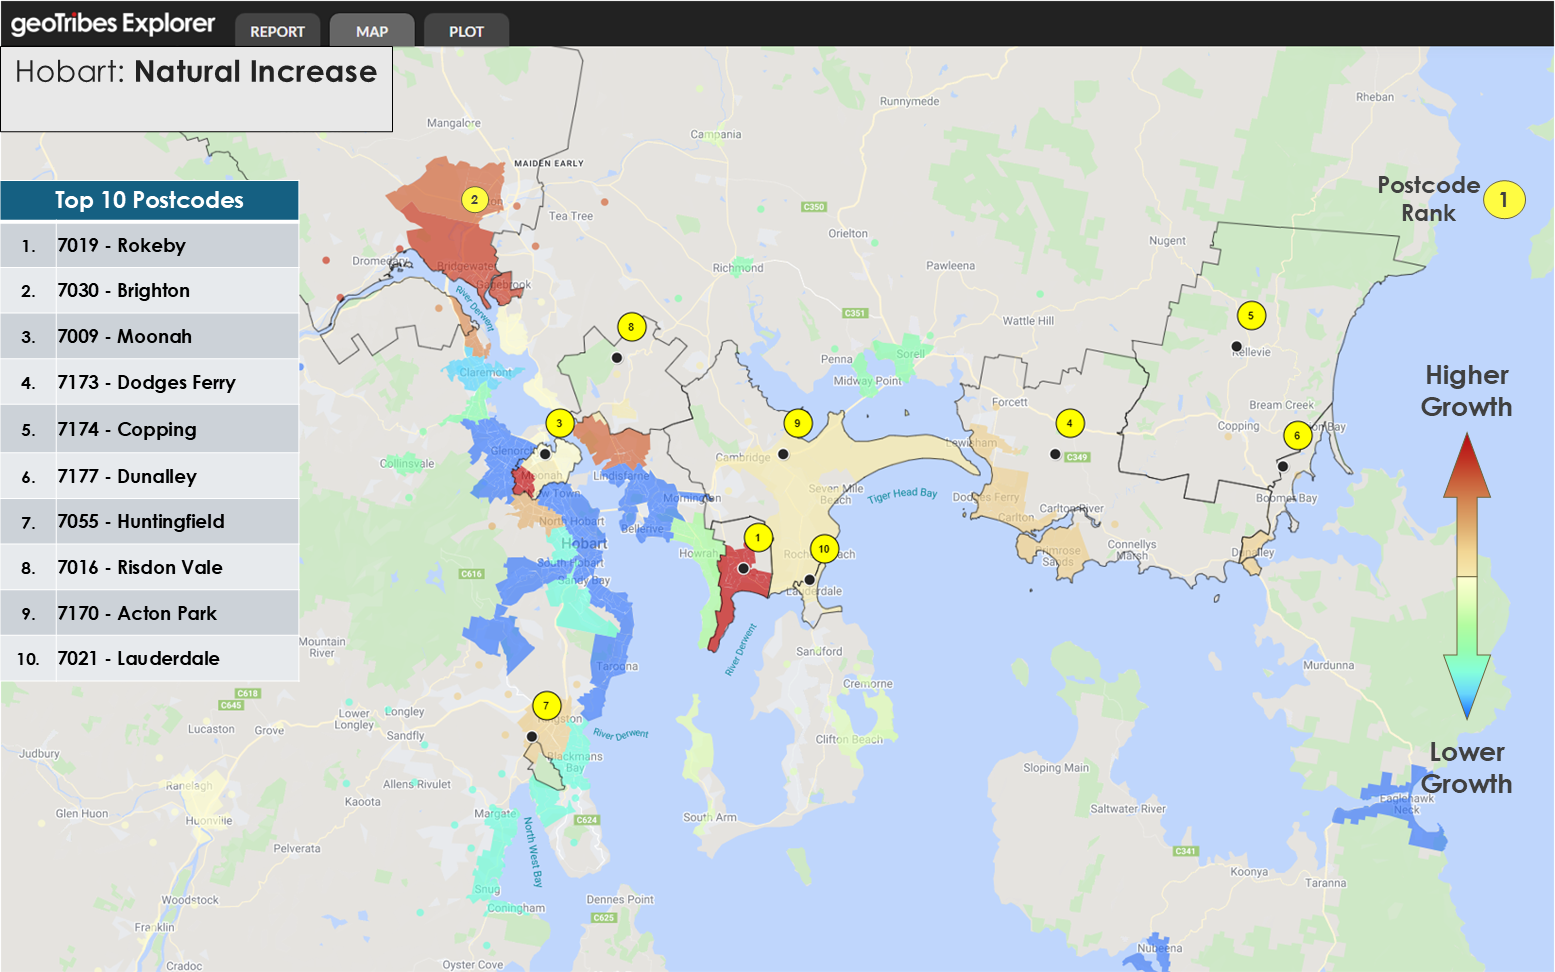
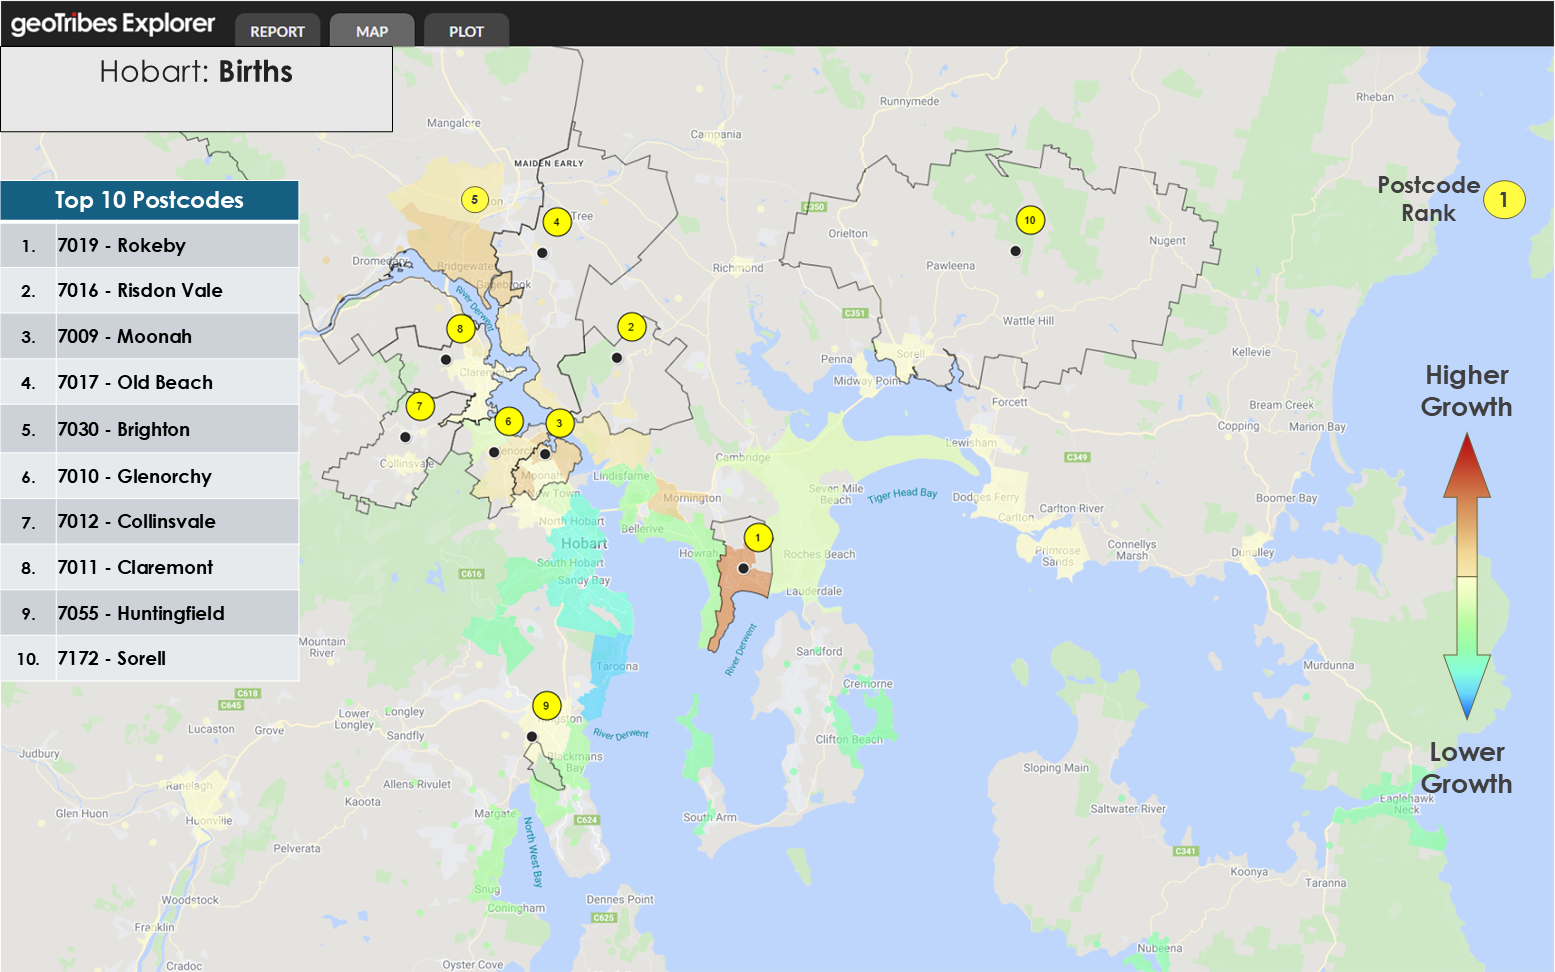
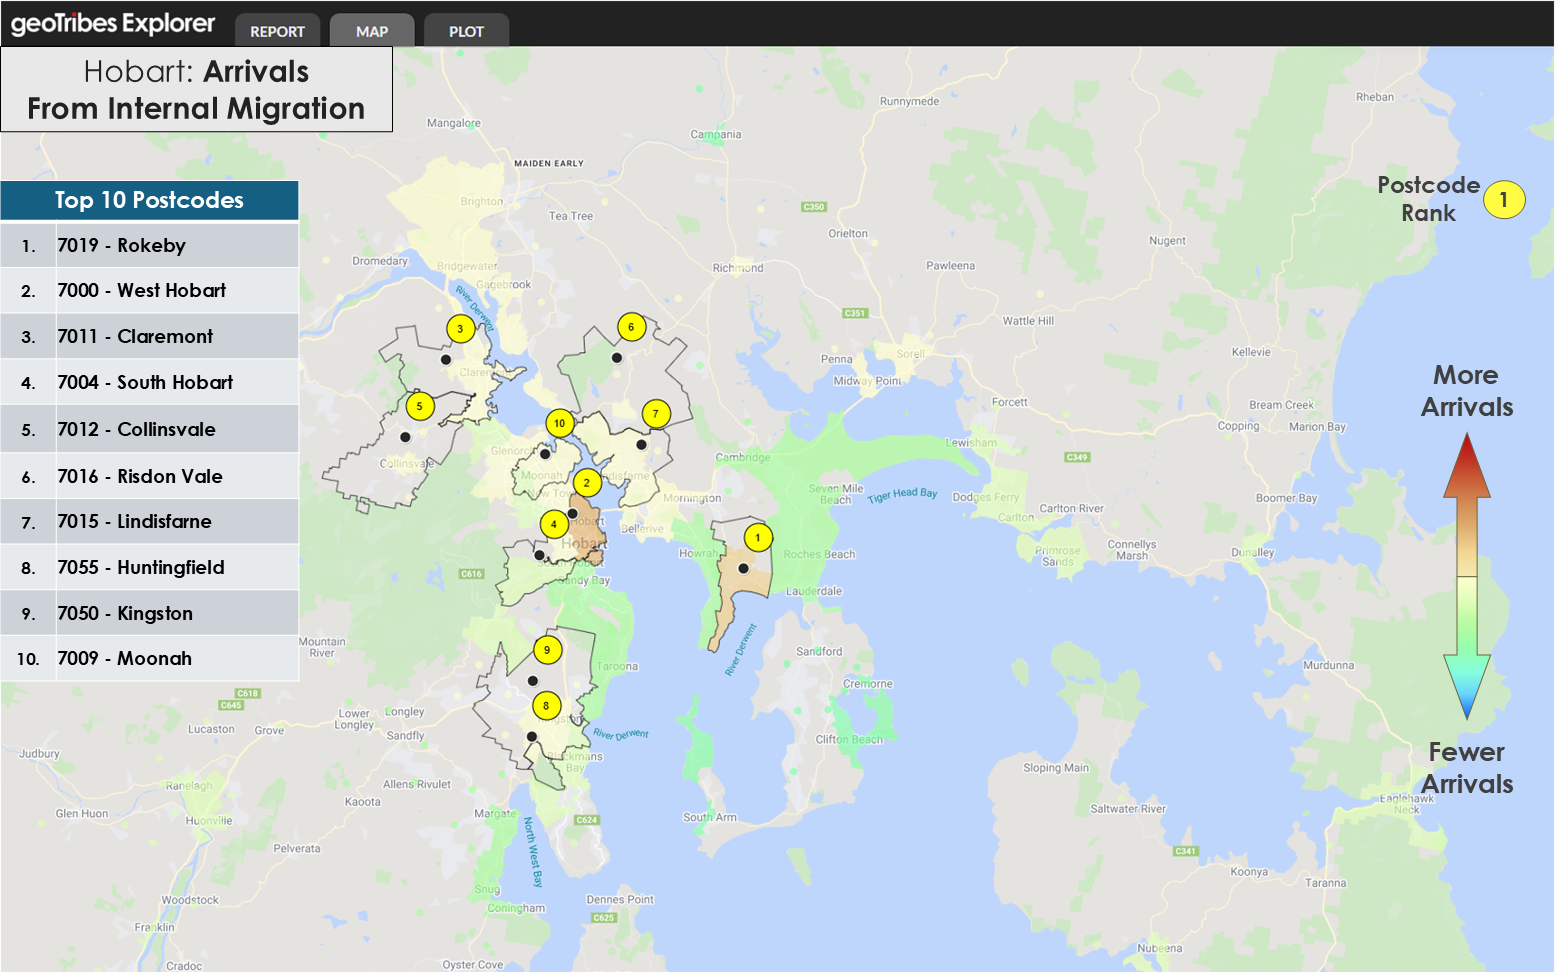
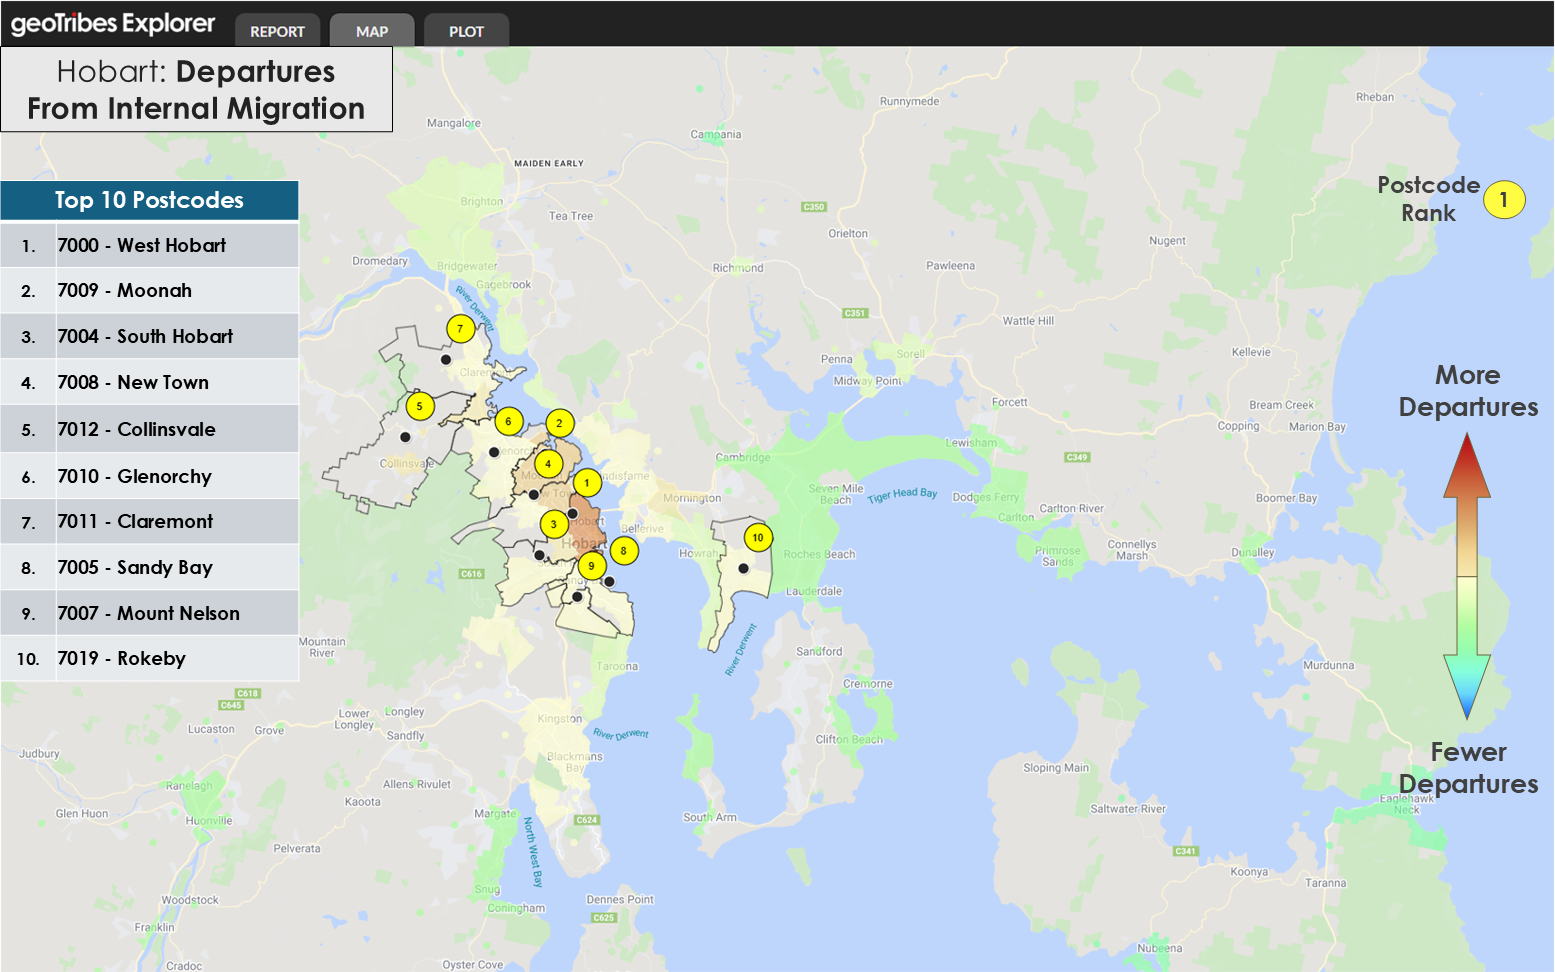
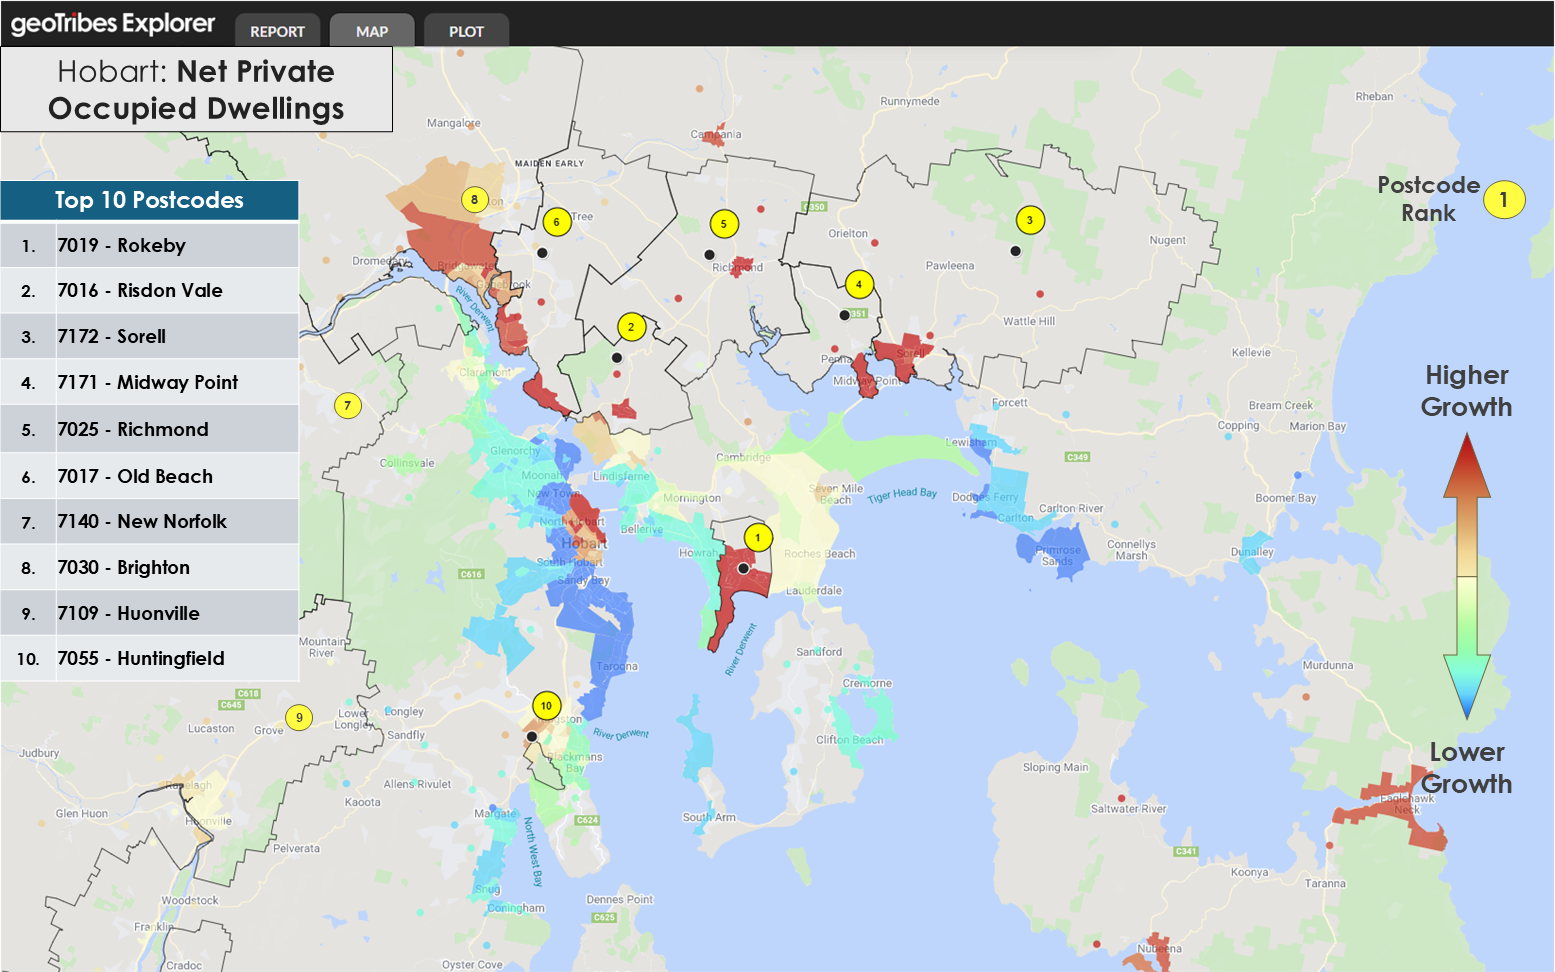
Growth was modest across most of the greater city area, with only one postcode (Rokeby) registering a relatively higher growth rate. Despite this, Hobart added 4,627 new private dwellings (4.8% growth), making it the only capital city to add more private occupied dwellings than new residents, with 0.9 new residents per new private occupied dwelling.
Conclusion
Australia’s population growth patterns between 2021 to 2024 reveal the rapid pace at which Australia’s demographic and cultural landscape is rapidly evolving. With 1.5 million additional residents in Australia, there is a fundamental need to base retail network analytics and market planning on updated population data, such as the population estimates and segment counts in the geoTribes Explorer, rather than relying on raw data from the 2021 census.