

With the initial release of the Australian Bureau of Statistics (ABS) 2021 Census Data, RDA has updated its geoTribes Culture Dimension, showing substantial shifts in the geographic dispersion of Australia’s increasingly multicultural population.
The geoTribes Cultural Dimension encapsulates the primary cultural driver of the neighbourhoods that people live in, rather than the people themselves. As such, it represents the cultural factors that someone would experience as they walked down the streets near where they live.
This analysis presents changes that have occurred over the 10-year period to 2021. During that time the % of persons in Australia who were born overseas has increased to 29.1%, which compares with UK (14.1 %), Canada (21.3%) and New Zealand (27.4%).
As illustrated in the following chart, the last 10 years has shown a dramatic change in Australia’s cultural composition, with the South Asian group now dominating both volume and velocity of change.
International Migration: Top 20 Countries & Regions, Showing Growth Velocity vs Volume
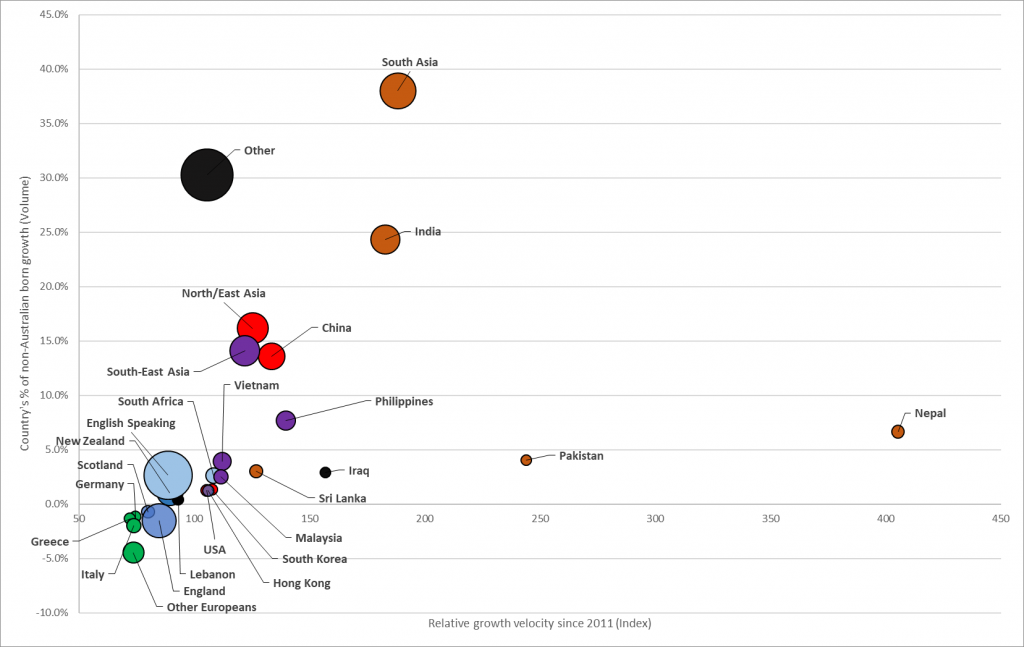
The above plot shows the top 20 non-Australian Countries-of-Birth, in terms of a relative growth velocity index of each country from 2011 to 2021 (X-Axis) plotted against the percentage of their contribution to the overall migrant growth (Y-Axis).
Nepal has the highest rate of growth at 300+% (400 on the index). Despite this however, its contribution to growth in Australia’s overseas born population over the last 10 years is only 10% – relatively small when compared to India or China.
From this graph, a few key trends can be determined. European and Middle Eastern country of births are gradually diminishing, with net negative growth. The big 2 countries of birth, being India and China, have contributed over 50% of the increase in Australia’s overseas born population for the last 10 years and while China’s relative growth rate has begun to slow it would now be fair to characterize the Australian multicultural distribution as being tri-modal, rather than diverse.
These movements provide a backdrop to changes in the geoTribes Culture Dimension.
10 Year Change in culture influence dimensions
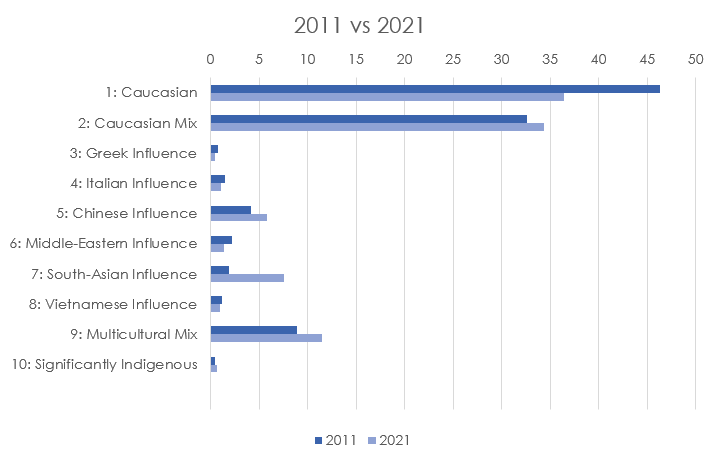
The most pronounced growth was a 300% increase in areas of South-Asian Influence (Afghanistan, Bangladesh, India, Nepal, Pakistan & Sri Lanka), which grew from 1.9% to 7.5% over the 10 years. Italian and Middle-Eastern Influence also declined significantly.
Compared to the 2011 Census, the biggest reduction was a 9.9% drop (46.3% to 36.4%.) in the population 18+ living in areas classified as Caucasian. Chinese Influence demonstrated the second largest percentage increase, with a growth of 40% from 4.2% to 5.9%. Greek Influence had the most pronounced decline from 0.8% to 0.5%. Significantly Indigenous has shown a large relative increase from 0.4% to 0.6%.
States and Territories
Table showing percentages of culture dimensions by state.

Percent change of the cell from 2011 to 2021
![]()
The distribution of cultural influence areas has remained varied nationwide, with Victoria overtaking New South Wales as the most culturally diverse State. Queensland remains predominantly Caucasian, as does Tasmania. Multicultural Mix is strong also relatively strong in South Australia and Western Australia.
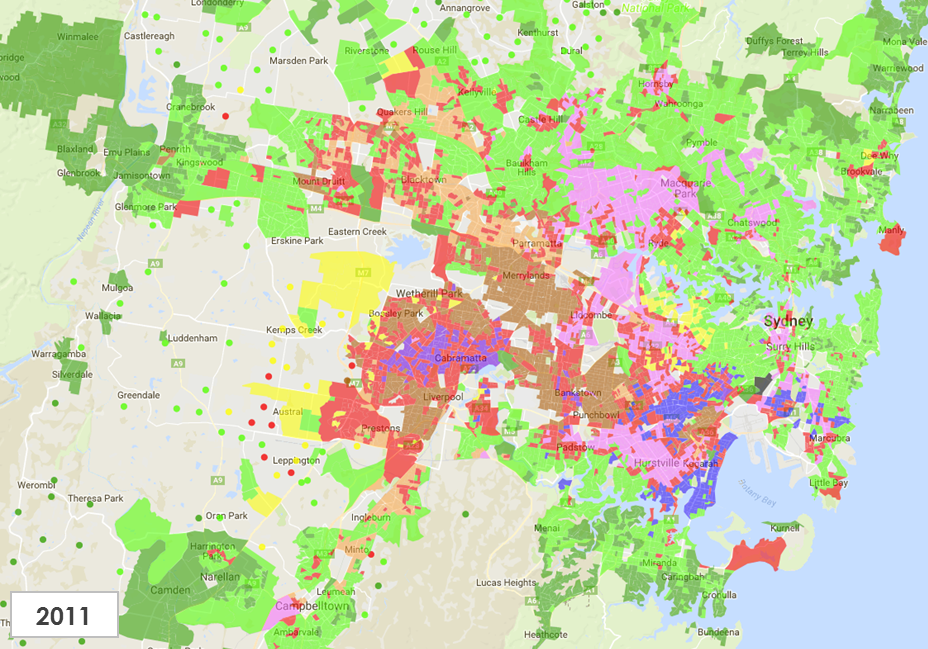
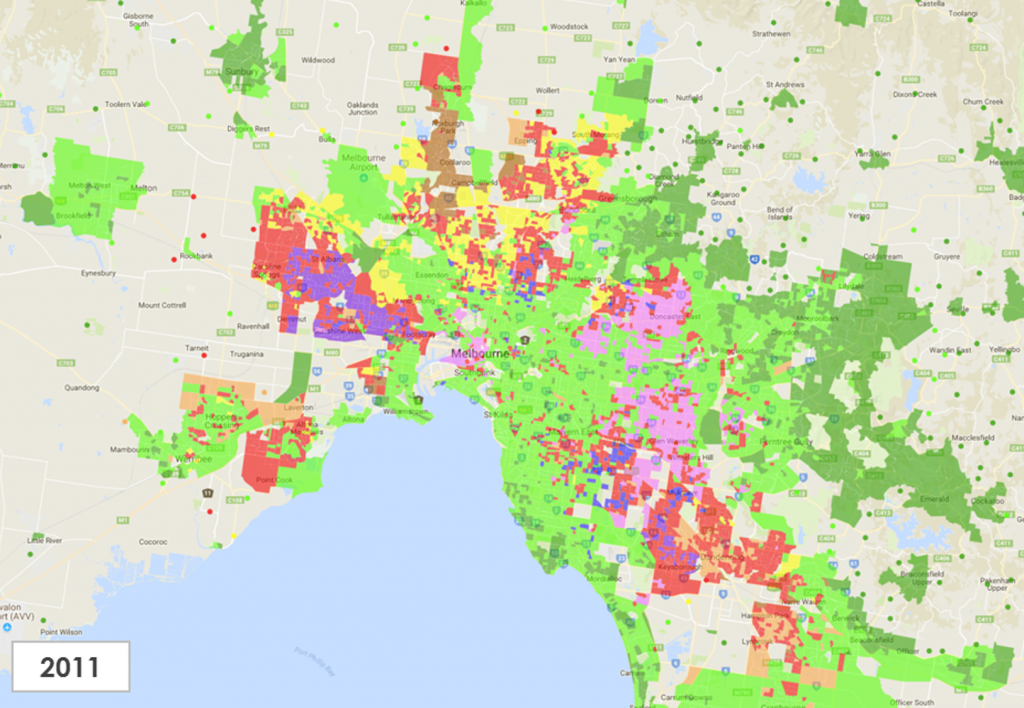
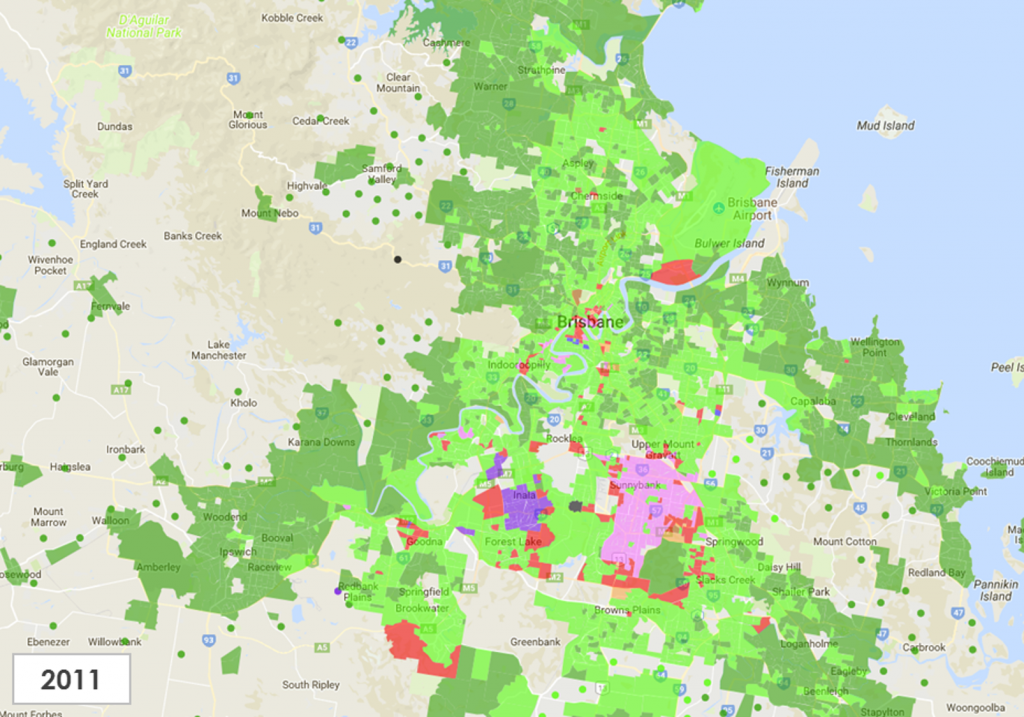
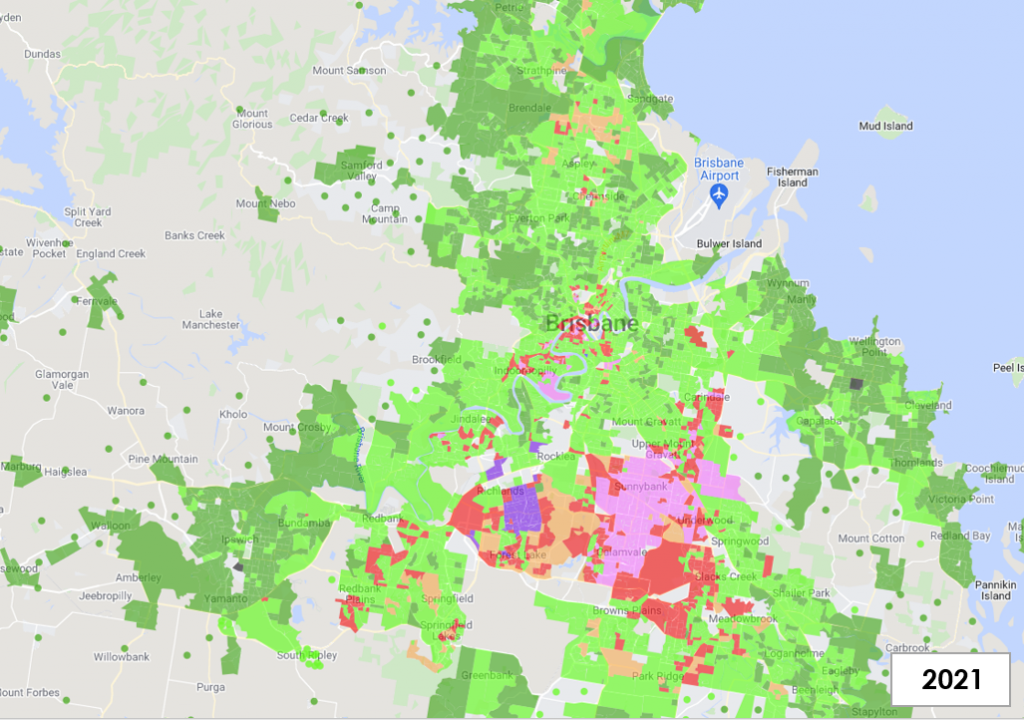
The slider-maps below compare 2011 SA1 Culture Dimensions (left) with the updated 2021 areas (right), use the slider to compare them.
Sydney
Chinese Influence (pink) areas have become more distinctive as lower North Shore hotspots spread out further, particularly along the Pacific Highway into Chatswood. Castle Hill and Hornsby have gone from Caucasian (green) to Chinese influence (pink).
South-Asian (orange), whose growth has largely come with Indian immigration, have extended with new housing developments and predominantly in Western Sydney. Multicultural areas, such as Blacktown and North Parramatta, that were previously less discerning now have a clear South-Asian Influence.


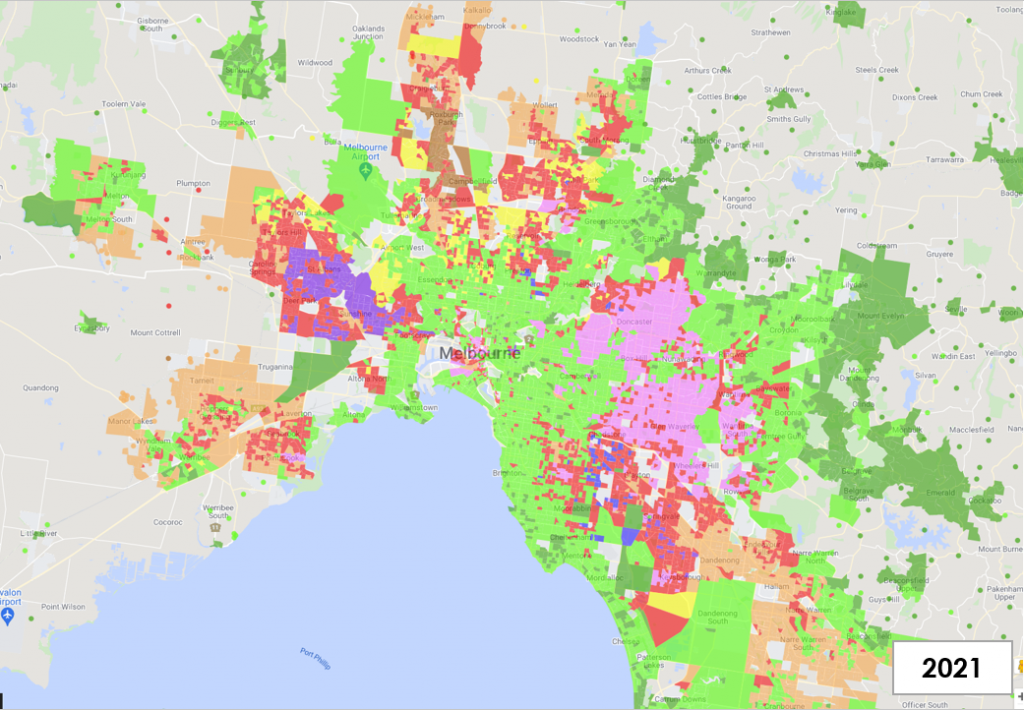
Melbourne
This traditionally strong Greek and Italian city would historically have been Caucasian (green), Greek (blue) and Italian (yellow), with a Vietnamese (purple) growth westwards from the 70’s & 80’s due to the influx of Vietnamese immigrants. However, replicating the nationwide trend, these localised population clusters have generally not been replenished and become relatively diminished.
Like Sydney, the notable growth has been an expansion of Chinese Influence (pink) in previously Caucasian (green) areas, and South-Asian (light brown) playing a key part in urban expansion in the big housing development areas on the city fringe.
Urban development in the CBD, particularly in proximity to the universities, has resulted in expanded areas of Chinese Influence (pink).
Brisbane
The trends of Sydney and Melbourne have not made their way to Brisbane as it remains largely Caucasian (green). However there are pockets appearing in new areas of housing development. Sunnybank remains a hub of Chinese Influence (pink), and there is evidence of a minor expansion of non-Caucasian within other pockets of the city.
If you have any questions about using geoTribes Culture Dimension codes in your market planning or as data appends in your analytics server, CRM system or marketing cloud or enhancing your first-party data more generally, contact the friendly RDA Technical Team on +61 2 8923 6600 or send an email to contact@rdaresearch.com